the use of indirect evaluation indexes is also allowed. Ming
et al
. (2006) used macro time of pixel processing, the number
of meaningless regions removed, as well as homogeneous and
heterogeneous goodness. Then, with special expertise, Ming
et al
. (2006) used the weighting summation method to add the
indexes together, and finally obtained the comprehensive seg-
mentation evaluation result. However, it is subjective to use
special expertise composite measures to set weighting indi-
ces. Zhang and Ming (2015) improved Ming’s method, coming
up with the entropy weight method to endow each goodness
with weight, which achieved ideal results. Moreover, analytic
hierarchy processes can be applied to endow different types
of goodness with hierarchical weights.
Problems and Analysis of Unsupervised Evaluation
Unsupervised evaluation methods can be widely used in the
evaluation of the segmentation results of different types of
high spatial resolution remote sensing images with differ-
ent segmentation algorithms. The segmentation results can
be objectively evaluated without knowing the content of the
segmented images. The unsupervised evaluation method can
not only be used for performance comparison and algorithm
selection of segmentation methods, and the setting of segmen-
tation parameters, but can also be used in the adaptive adjust-
ment of segmentation parameters, which other segmentation
evaluation methods do not possess.
Before the segmentation of the experimental images, the
optimal parameters of the segmentation algorithms need to be
set, using the parameters that gave the best segmentation re-
sults of a series of test images. However, the optimal parame-
ters need to be chosen according to a large number of segmen-
tation experiments or the researchers’ experience. Although
the supervised evaluation method is capable of automatically
selecting the optimal segmentation parameters based on the
reference data of test images, the chosen optimal parameters
may not be appropriate and suitable in the subsequent experi-
ments of experimental images, unless the reference dataset is
built for all the experimental images. Besides, the segmenta-
tion parameters cannot be adjusted automatically according to
the segmentation results of the experimental images. Com-
paratively speaking, with the characteristic of not requiring
reference data, the unsupervised evaluation method is adapt-
able and its parameters have the ability to self-adjust, which
is especially suitable for automatic segmentation information
extraction and analysis system. The reliability of unsuper-
vised methods depends on the rationality of the chosen good-
ness, correlation, and weight distribution between goodness.
In addition, to avoid biased evaluation, the attributes and the
principles of the selected goodness should be different from
the segmentation algorithm being evaluated. Therefore, in
the field of unsupervised evaluation field, determining how
to build a universal evaluation goodness and set the optimal
weights for each goodness reasonably should be a key focus
for future research.
Experimental Comparisons and Analysis
Of all the segmentation evaluation methods, supervised
and unsupervised evaluation methods are more objective
than other non-quantitative evaluation methods (such as an
analytical evaluation method). However, from the point of the
application fields of the two kinds of segmentation evaluation
methods, supervised method is more suitable for accurate ob-
ject extraction (especially artificial target recognition) because
the supervised evaluation methods pay more attention to the
accuracy of geometric boundary, which makes it effectively
used in selecting the optimal segmentation algorithm for an
image segmentation task or selecting the optimal segmenta-
tion parameter for a certain segmentation algorithm.
While unsupervised evaluation methods are more suitable
for object based image classification which stresses the identifi-
cation of all kinds of objects, because unsupervised evaluation
methods pay more attention to the homogeneity within the
segmented patches, as well as the heterogeneity between the
segmented patches. Homogeneity and heterogeneity are the two
basic criteria for accurate classification because high homo-
geneity means the high consistency within a class and high het-
erogeneity means high seperability between different classes.
Hence, this paper respectively designs different experi-
mental frames with different experimental images for differ-
ent applications. It should be noted that the purpose of the
experiments is not to compare the advantages and disadvan-
tage between different segmentation methods, but to prove
what respects can supervised and unsupervised evaluation
methods be applied from the point of the application of geo-
science.
Experiments of Supervised Segmentation Evaluation Methods
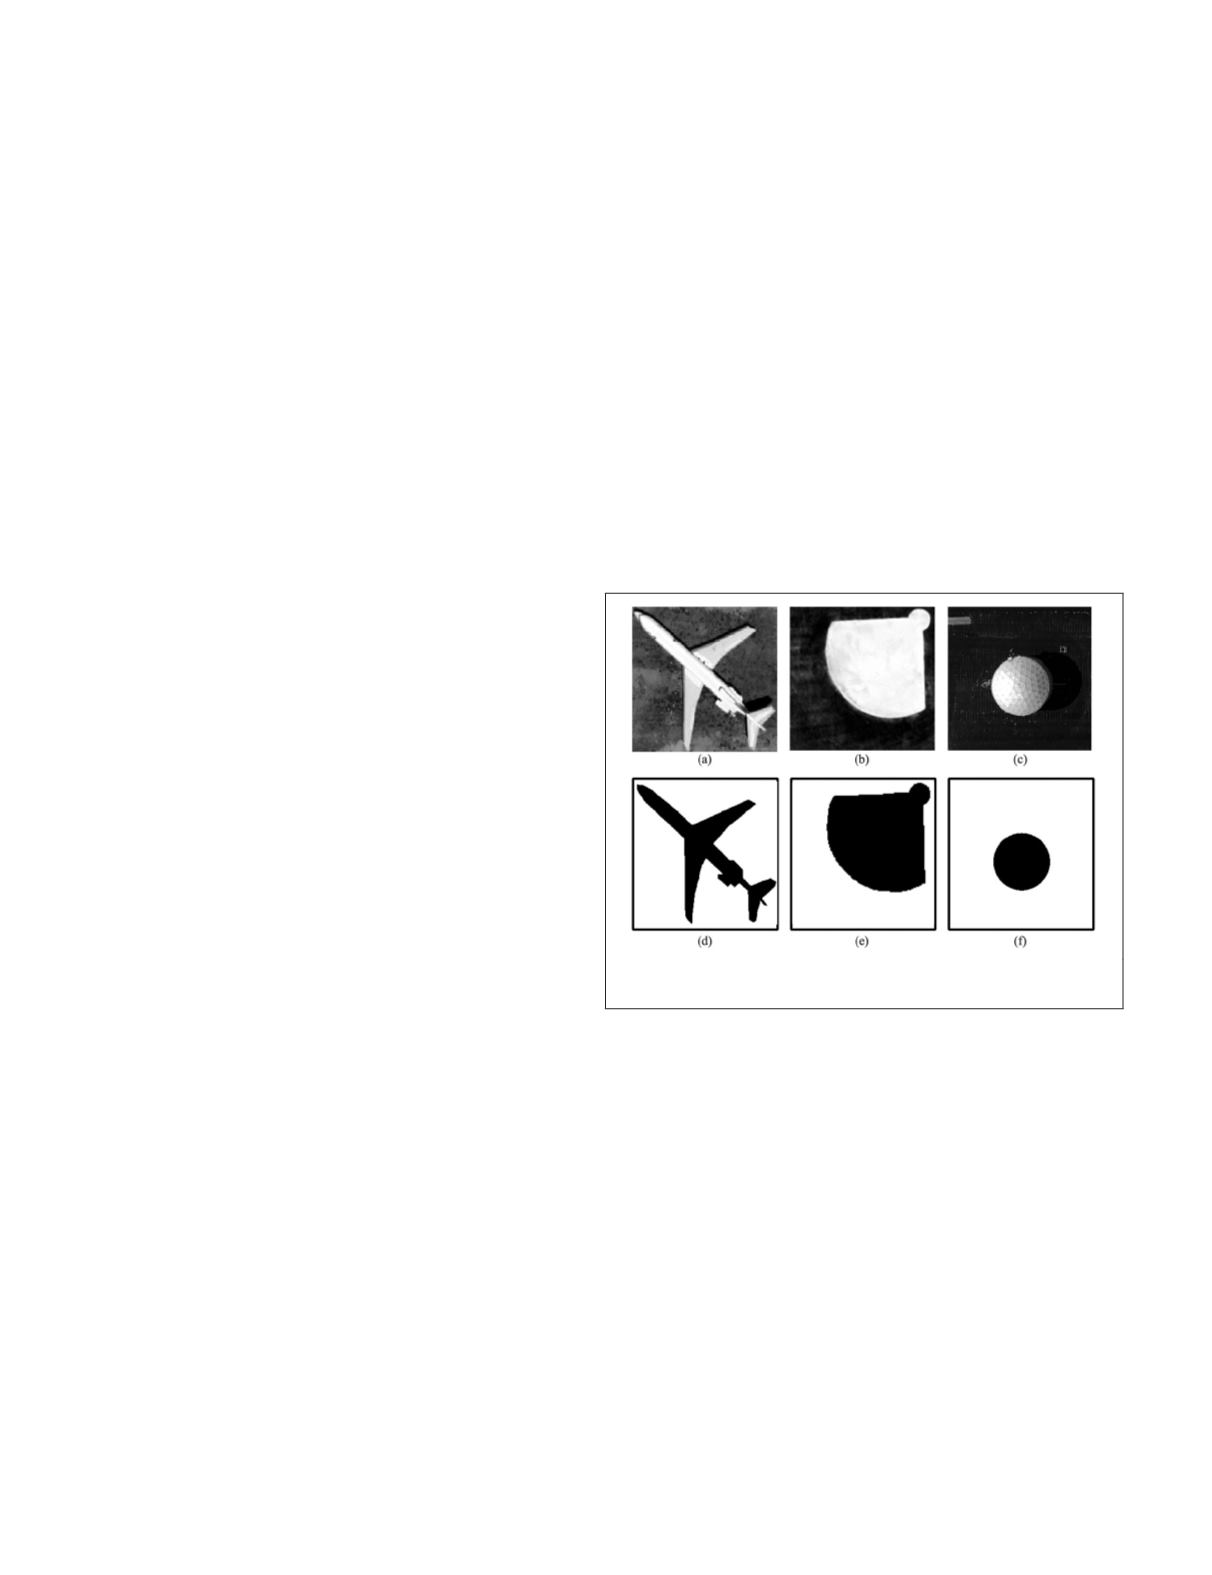
As shown in Figure 7, three image datas, respectively contain-
ing airplane (Figure 7a, and 7d), baseball court (Figure 7b,
and 7e), and storage tank (Figure 7c, and 7f), are all from UC
Merced landuse dataset and the corresponding referenced
polygons are extracted by manually vectorization.
Figure 7.Experimental data: (a-c) original images, (b)
reference datasets.
To demonstrate the performance of supervised segmenta-
tion evaluation, six commonly used and classical segmenta-
tion algorithms, Region Growth (
RG
) (Shih and Cheng, 2005),
Mean-Shift (
MS
) (Comaniciu and Meer, 2002; Ming
et al
.
2016), Split and Merge (
SM
) (Gonzalez and Woods, 1992),
Maximum Entropy (
ME
), (Wong and Sahoo, 1989), Fuzzy
Threshold (
FTH
) (Tobias and Seara, 2002) and
OTSU-2D
(Otsu,
1979) are employed as experimental algorithms. More details
about the six segmentation algorithms, please refer to the
related references. Two classes, object and background, are
separated in the segmentations by using the six algorithms
with appropriate parameters. The parameters for a certain
algorithm are selected by visual judgment. Figure 8 displays
the segmentation results by using different algorithms.
Five supervised evaluation indexes based on geometric
discrepancy (
ADI
,
AFI
,
QR
,
ED1
, and
qLoc
) are tested in the experi-
ments. The evaluation results by using these five indexes are
illustrated in Figure 9. In order to compare each index more
intuitive, the value of
qLoc
was shrunk by a factor of 100.
Evaluation indexes based on arithmetic discrepancy was not
involved in the experiments, because for the segmentation
result of interesting object, there are always have one-to-one
640
October 2018
PHOTOGRAMMETRIC ENGINEERING & REMOTE SENSING


