not only the homogeneity within
the segmented object, but also the
homogeneity of its adjacent ones.
The goodness based on spectral
variance, especially Local Variance
(
LV
) (Woodcock and Strahler 1987),
namely
UM
, as mentioned above,
are the most frequently applied
indexes in remote sensing field at
the moment. Dr
ǎ
gu
ţ
et al. (2010)
selected the optimal segmentation
parameters for remote sensing im-
ages by using
LV
goodness. Belgiu
and Dr
ǎ
gu
ţ
(2014) used
LV
good-
ness to evaluate the segmentation
algorithm for extracting building
information from very high spatial
resolution remote sensing images.
Zhao et al. (2012) used
ROC-LV
goodness, which is similar to the
ESP
tool designed by Dr
ǎ
gu
ţ
et al.
(2010), to choose the optimal scale
parameters of slope segmentation
in a loess plateau.
The calculation formula of
LV
goodness is as follows:
V
f x y
A
f x y
A
i
x y R
i
x y R
i
i
i
=
(
)
−
(
)
( )
∈
( )
∈
∑
∑
,
,
,
,
1
2
(31)
where
V
i
,
R
i
, and
A
i
represent the intra-region heterogeneity,
the range, and the size of the segmented object, marked as
i
,
respectively.
f
(
x,y
) serves as the grey value or spectral value of
the pixel with coordinates
x,y
. However, this goodness, which
demonstrates a negative correlation between the values and
the intra-region homogeneity, is not a direct evaluation of the
intra-region heterogeneity.
Wang
et al
. (2016) made some improvements to
LV
with the
proposed Weighted Local Variance
(
WLV
)
, taking lengths of ad-
jacent sides and the area of segmented object as weights. The
choice of the optimum scale parameter is realized by evaluat-
ing the homogeneity of multiple adjacent segmented objects.
In order to transfer the scope of evaluation of the homogene-
ity from a single segmented object to the whole image, it is possi-
ble to use the area weighting method to transform local variance
into a local variance index and apply it to global assessment.
V
A V
A
i
n
i
i
i
n
i
=
=
=
∑
∑
1
1
.
(32)
where
n
is the quantity of the segmented objects of the whole
image.
Goodness Based on Texture
Focusing on texture goodness, Weszka and Rosenfeld (1978)
described the
Busyness
goodness to evaluate intra-region
homogeneity, according to the rule that ideal segmentation
results should have simple and compact forms without strong
textures. In addition, Levine and Nazif (1985) put forward
PV
goodness, using a textural measure of
R
calculating textural
homogeneity within a segmented object. Both
PV
and
Busy-
ness
are global goodnesses which focus on whole images. The
variance of texture value with a segmented object can also be
used in
UM
, in lieu of the spectral variance, to evaluate texture
heterogeneity.
Goodness Based on Entropy
As for goodness based on entropy, Pal and Bhandari (1993)
proposed a Higher Order Local-Entropy goodness that
evaluates intra-region homogeneity through maximizing the
second-order local-entropy of the segmented object and its
background. Zhang et al. (2004) defined the entropy-based
objective evaluation method (E) by using the entropy-based
method to calculate the pixels’ spectral uniformity of the
segmented object.
Hetrogeneity Goodness Indexes
Heterogeneity goodness indexes were proposed to evaluate
segmentation quality according to the second rule of ideal
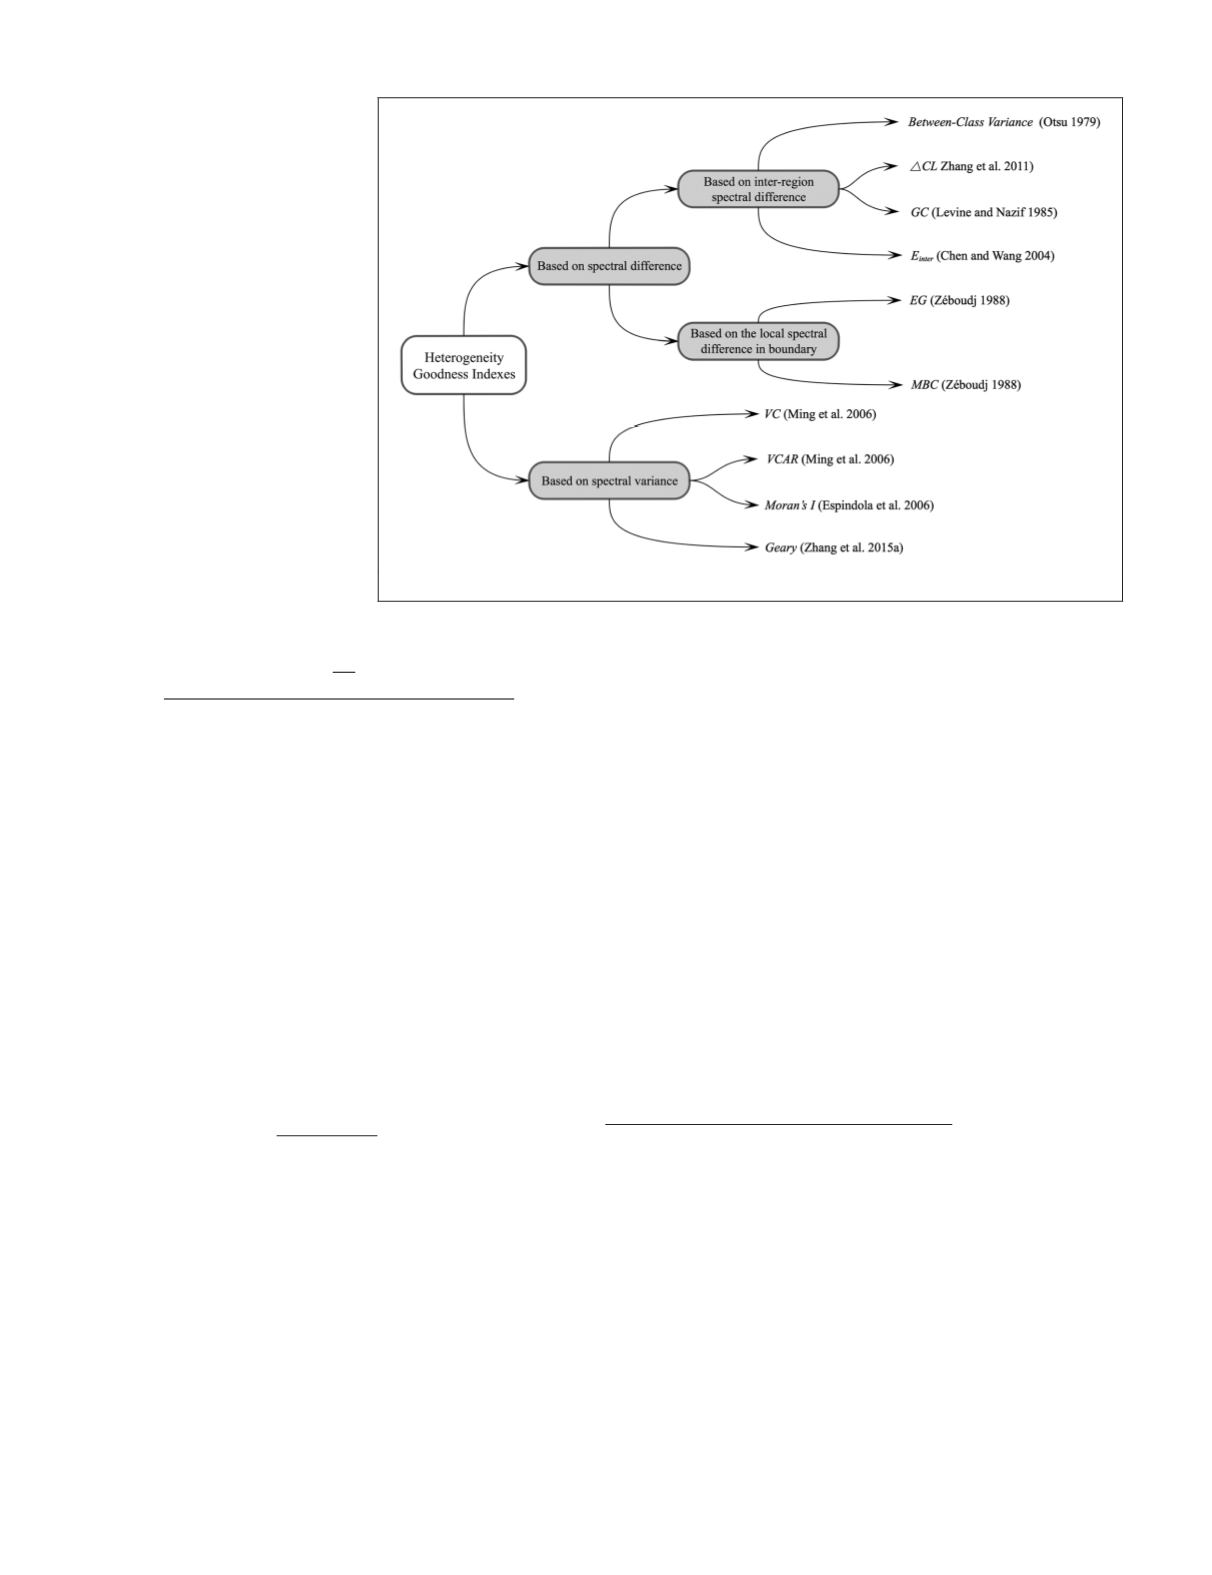
segmentation. As shown in Figure 6, heterogeneity goodness
indexes fall into two categories: Goodness based on spectral
difference and goodness based on spectral variance. Further,
the goodness based on spectral difference can be subdivided
into two categories, one based on inter-region spectral differ-
ence and the other based on the local spectral difference in
boundary.
Goodness Based on Spectral Difference
Goodness based on inter-region spectral difference
Otsu (1979) proposed the
Between-Class Variance
goodness
through calculating the difference of the squared average
spectral value between the segmented object and its adjacent
object.
Zhang et al
. (2011), measuring inter-region heterogene-
ity by calculating the difference of the average spectral values
between the segmented object and all adjacent objects, and
using the adjacent boundaries weight method, created the
Δ
CL
index. This index is often used jointly with
LV
goodness
in the form of
RMAS
goodness. However, relying merely on
the spectral difference cannot explain the degree of deviation
of grey level, or spectral level, between the segmented objects.
Levine and Nazif (1985) put forward Grey Level Contrast
Measure
(GC)
goodness, which has improved reliability, since
it describes inter-region heterogeneity according to the differ-
ence-sum ratio of the adjacent objects’ average spectral values.
Moreover,
GC
also calculates the composite heterogeneity of
all adjacent objects, by setting the area weight. Inter-Region
Figure 6. Hierarchical map of commonly used heterogeneity goodness indexes.
638
October 2018
PHOTOGRAMMETRIC ENGINEERING & REMOTE SENSING


