relationship between segmented object and reference object in
most cases.
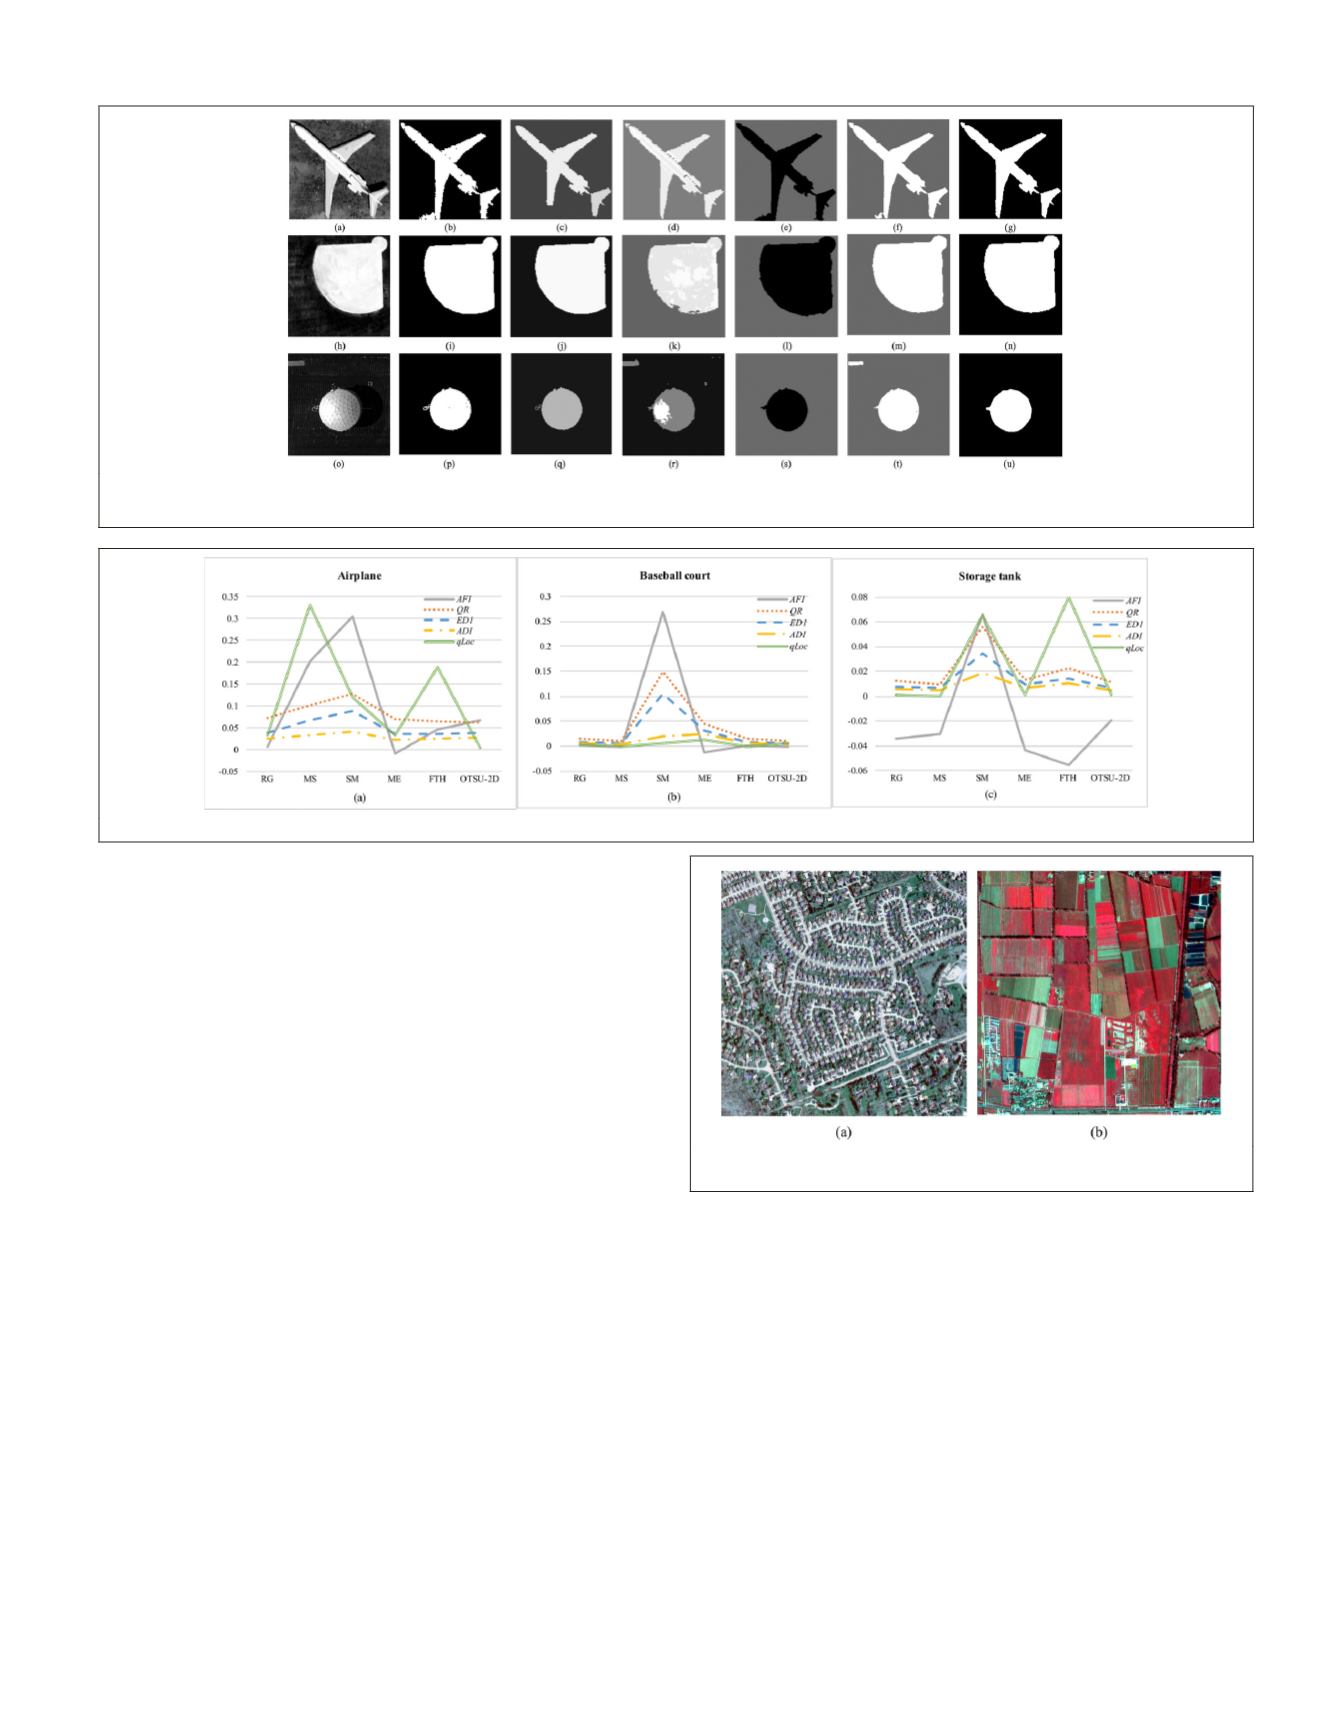
According to the results of Figure.9,
QR
,
ED1
,
and
AFI
are respectively appropriate for the three original images,
which is consistent with the visual judgment. Figure.9 also
shows that there is strong correlation between
QR
,
ED1
,
and
AFI
; Among them,
AFI
showed higher sensitivity while the
evaluation results of airplane is not accurate enough for
FTH
and
OTSU-2D
.
ADI
is the fourth best performance supervised
evaluation index in the experiments, which produced almost
the same evaluation results as
QR
,
ED1
,
and
AFI
in most cases.
However, as shown in Figure 8k and 9b, the evaluation result
of
ADI
is unreasonable once some over-segmented objects are
within the range of interesting object, just like the segmenta-
tion result of storage tank by using
SM
. As for
qLoc
, there exist
obvious discrepancies between evaluation results and visual
judgment of the segmentation result of airplane. These results
also demonstrate that minor location differences between
segmentation objects and reference object doesn’t mean ideal
segmentation results. Additionally, this experimental results
show that area-based supervised segmentation evaluation
index is helpful for choosing the appropriate segmentation
algorithm for a specific target recognition task.
Experiments of Unsupervised Segmentation Evaluation Methods
The main purpose of
GeOBIA
is to classify the whole image.
Segmentation toward
GeOBIA
does not only focus on one
certain object, but also pays attention to all kinds of object
types. As is well known, the appropriate scale for different
kind of object is different, so multi-scale segmentation is
necessary for object-based image classification. Based on the
global segmentation evaluation with homogeneity and hetero-
geneity indexes, scale selection or scale optimization of the
multi-scale segmentation is especially meaningful for
GeOBIA
classification. For homogeneity, area weighting local variance
index
(V)
represented by Equation 32 is a well-recognized in-
dex to measure the homogeneity goodness. For heterogeneity,
Variance Contrast Across Region Measure
(
VCAR
)
and Moran’s
I goodness
(MI)
respectively given by Equations 34 and 35 are
commonly used hetrogeneity goodness indexes. So, this paper
mainly calculates these three indexes in the unsupervised
segmentation evaluation experiments after a normalization
process. The details of normalization process, please refer to
(Ming
et al
., 2012). The normalized evaluation indexes are
respectively marked with
NV
,
NVCAR
, and
NMI
.
As shown in Figure 10, two pieces of multi-spectral image
(both with size of 1,000×1,000 pixels), respectively, covering
residential area and farmland area are used as experimental
data. Urban scene A is a multispectral subset aerial panchro-
matic image obtained from the Erdas Imagine
®
example data-
set (Pansharpened SPOT-5 image with 2.5-meter resolution).
Figure 8. Segmentation results by using different segmentation algorithms: (a, h, o) original images, (b, i, p)
RG
, (c, j, q)
MS
(d,
k, r)
SM
, (e, l, s)
ME
, (f, m, t)
FTH
, (g, n, u)
OTSU-2D
).
Figure 9. Supervised evaluation by using different segmentation algorithms: (a) airplane, (b) baseball court, and (c) storage tank).
Figure.10 Experimental image data: (a) Urban scene-A, (b)
Rual scene-B.
PHOTOGRAMMETRIC ENGINEERING & REMOTE SENSING
October 2018
641


