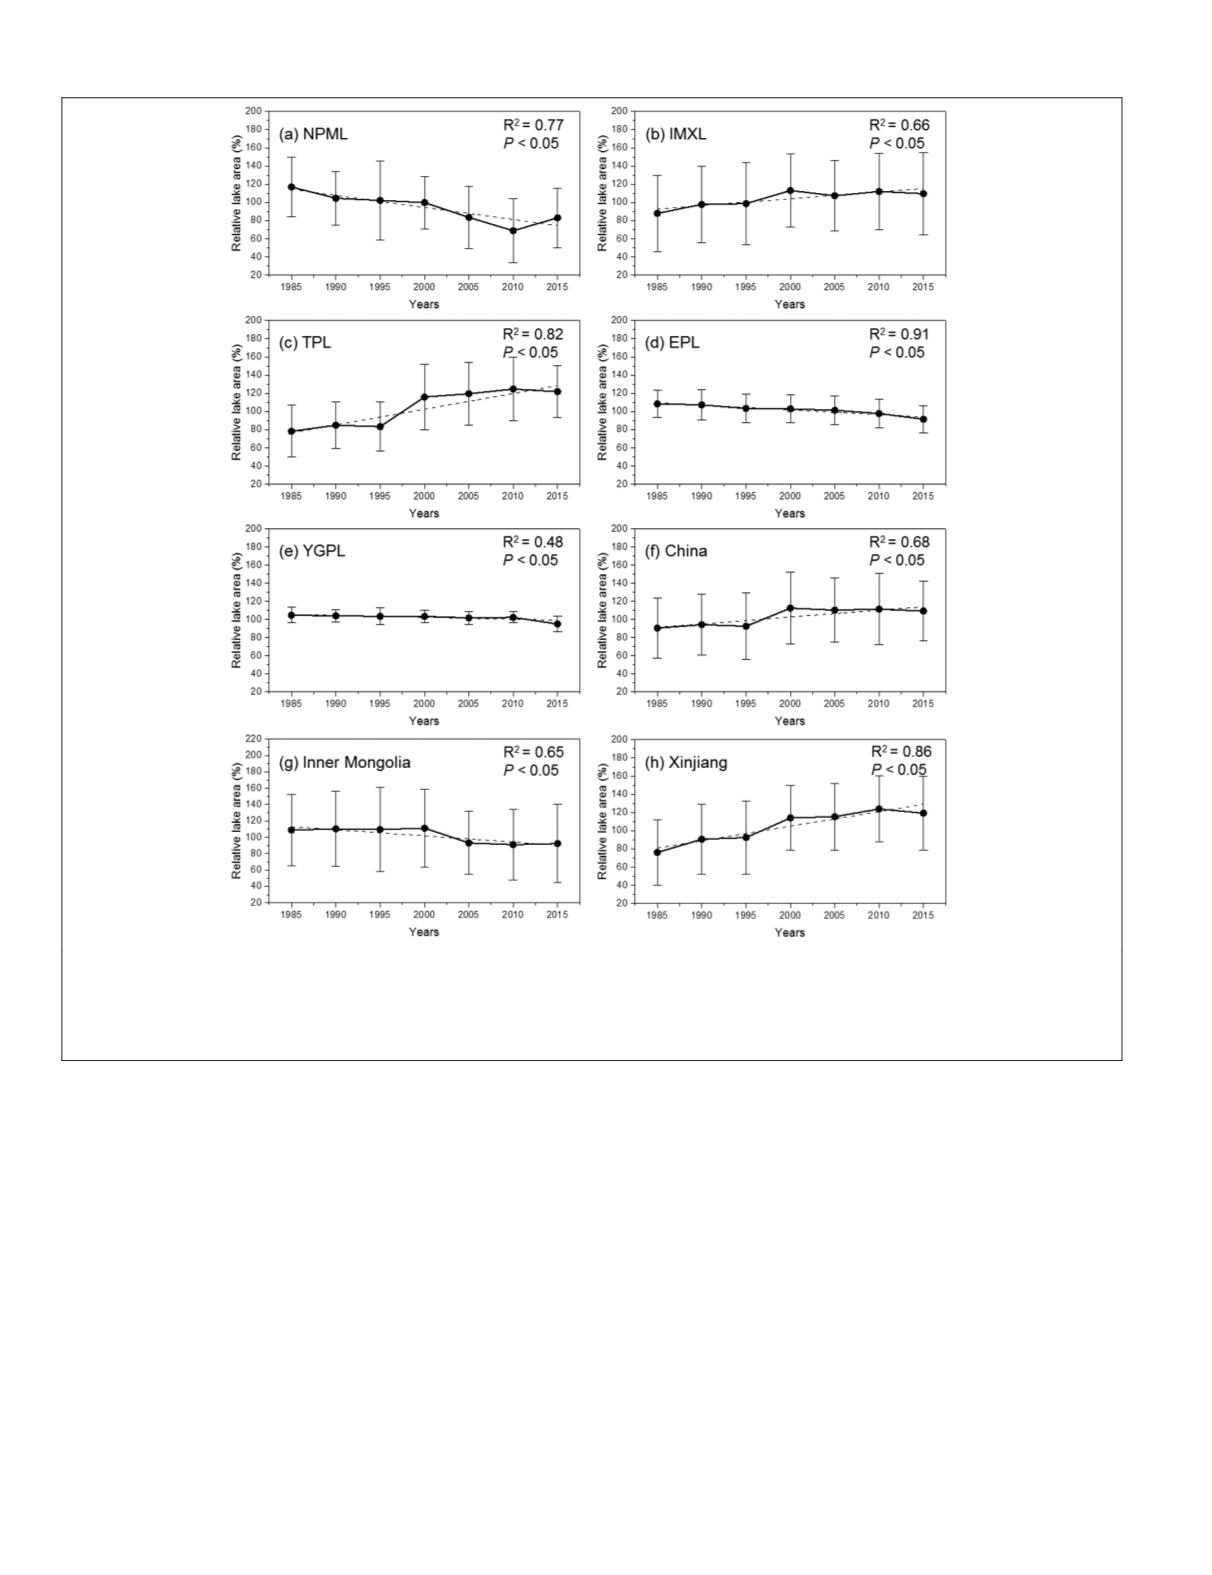
(downward trend, R
2
= 0.65,
p
<0.05, Figure 6g) and Xinjiang
(upward trend, R
2
=0.86,
p
<0.05, Figure 6h). The distinctly
different patterns of lake area changes were also detected
on the Tibetan Plateau and the Mongolian Plateau during
the last four decades, with a significant inflection point of
lake changes at 1997/1998 (Zhang
et al.,
, 2017a). The chang-
ing pattern (i.e., rapid expanding or shrinking) of lake area
exhibited a strong spatial heterogeneity in a given lake-zone,
which could result in a large variance of relative surface area
of different lakes. The fluctuation in lake area could be related
to the combined influence of climate change and human
activities. Overall, the relative water area of the lakes across
the entire China exhibited a prominent increase (R
2
= 0.68,
p
<0.05, Figure 6f) during the period of 1985 to 2015.
Relationships Between Lake Changes and Driving Factors
To explore the possible driving forces of lake changes, cor-
relation analysis was performed between the overall changes
in the relative water area of lakes (
≥
10 km
2
) and the climatic
and human factors in the five lake zones from 1985 to 2015
(Table 4). Over the past 30 years, a consistent increase in hu-
man population and irrigated area (Figure 7c and d) has been
observed in the
NPML
and
EPL
zones, showing a significant
negative correlation (
P
<0.05) with the area changes of lakes
in both regions. As the major grain production bases in China,
the
NPML
and
EPL
zones have experienced a rapid increase
in the area of irrigated cropland (increased by 319.0% and
22.4%, respectively) from 1985 to 2015 (Figure 7d), resulting
in the overexploitation of both surface water and groundwa-
ter resources for agricultural irrigation. For example, under-
ground aquifers are the primary source of water for irrigation
in the North China Plain, and the excessive irrigation has led
to a rapid reduction in the groundwater depth from about
10 m below the ground in the 1970s to about 30 m in 2001
(Zhang
et al.,
, 2003). Therefore, irrigation water consump-
tion is an important factor for the lake area decrease in these
regions. Along with rapid population growth, the
EPL
has also
witnessed unprecedented urban sprawl in recent decades,
with a huge increase in built-up area from 5.2 × 10
3
km
2
in
Figure 6. Temporal changes in the relative lake area in the (a)
NPML
, (b)
IMXL
, (c)
TPL
, (d)
EPL
, (e)
YGPL
, and (f) entire China
from 1985 to 2015. The lake changes in the two adjacent regions in the
IMXL
, i.e., Inner Mongolia and Xinjiang, are also
shown in (g) and (h), respectively. The mean lake area between 1985 and 2015 is used as the reference. Error bars indicate the
standard error of changes in the large lakes (
≥
10 km
2
). The goodness-of-fit of the least squares regression was assessed using
the coefficient of determination R
2
.
662
October 2018
PHOTOGRAMMETRIC ENGINEERING & REMOTE SENSING


