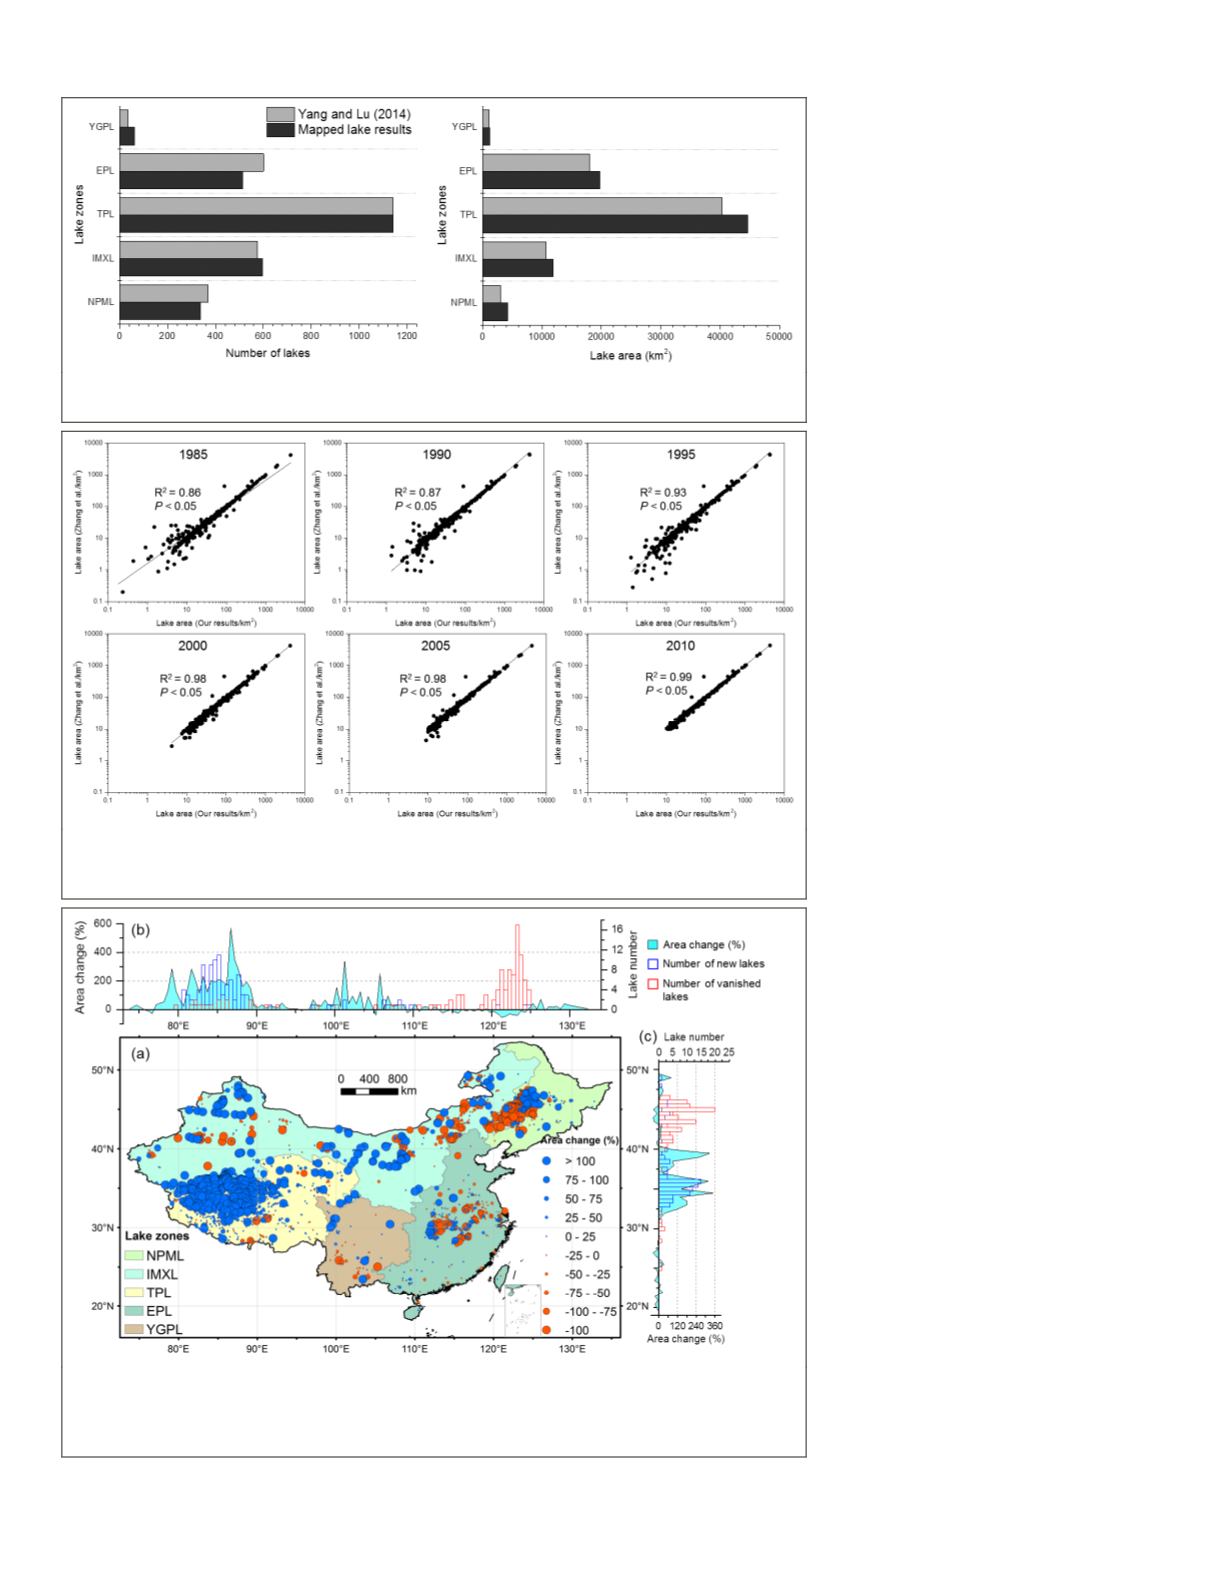
the developed lake datasets were
further compared to another two
datasets, including the national-
level lake dataset produced by
using Landsat
TM
/
ETM+
images
from 2005 to 2008 (Yang and Lu,
2014) and the regional-level lake
dataset for the Tibetan Plateau
between 1976 and 2013 (Zhang
et
al.
, 2017a). The number and areas
of the mapped lakes in this study
were compared to the nationwide
lake results for the episode of 2005
(Figure 3). In general, the datas-
ets obtained in this study show
relatively consistent results as
compared to the datasets from the
literature. Moreover, the lake data-
sets created by Zhang
et al
.(2017a)
over the Tibetan Plateau using
Landsat images between 1976 and
2013 were also used to validate the
mapped lake results in this study.
A relatively high agreement (0.86
≤
R
2
≤
0.99,
P
<0.05) for the lake
areas of the Tibetan Plateau (Zhang
et al.
, 2017a) and the lake results
in this study for 1985, 1990, 1995,
2000, 2005, and 2010 can be seen
in Figure 4. It should be noted that
the slight discrepancy between
the two datasets can be attributed
to the different acquisition times
of the source Landsat images. The
validation and comparisons imply
that the lake datasets developed in
this study can provide a reliable
basis for continuous monitoring of
lake changes in China.
Changes in the Area and Number of Lakes
Over the Past Few Decades
The area and number of all the
lakes in China between 1990 and
2015 are listed in Table 2. To fa-
cilitate the analysis of the changes
in different-sized lakes, the lakes
were divided into four groups: 1
to 10 km
2
; 10
to 100 km
2
; 100
to
1000 km
2
; and >1000 km
2
(Ma
et
al.
, 2010; Wang and Dou, 1998). A
total of 2,924 lakes were detected
across the entire country in 1990,
of which the four groups occupied
79.8%, 15.8%, 4.0%, and 0.4%, re-
spectively. Over the past 25 years,
the total area of lakes has increased
by 4616.7 ±296.3 km
2
(6.0 ±0.4%)
while the number of lakes has
experienced a net reduction of 5
(from 2,924 to 2,919), referring to
109 vanished lakes and 104 newly
formed lakes (Table 2). Geographi-
cally, most of the vanished lakes
are concentrated in Northeast Chi-
na (120° to 125° E, 40° to 47° N),
with 50 (45.9% in proportion) in
the
NPML
and 49 (45.0% in propor-
tion) in Inner Mongolia (Figure 5,
Figure 3. Comparisons between the number and areas of the national-level lakes (Yang
and Lu 2014) and the lake results produced in this study for the episode of 2005.
Figure 4. Comparisons between the lake datasets of the Tibetan Plateau (Zhang
et al
.
2017) and the lake datasets produced in this study for 1985, 1990, 1995, 2000, 2005,
and 2010.
Figure 5. (a) Distribution of area changes in lakes (
≥
1 km
2
) between 1990 and 2015. The
longitude (b) and latitude (c) summaries (an interval of 0.5°) of area changes in lakes,
number of newly formed lakes, and number of vanished lakes are shown on the top
and right, respectively.
660
October 2018
PHOTOGRAMMETRIC ENGINEERING & REMOTE SENSING


