on the lakes greater than 1 km
2
in size, which has been
commonly used as the minimum lake unit in China (Fang
et
al.,
2005; Liu
et al.
, 2013; Ma
et al.,
, 2010). The uncertainty of
the lake area mapping was mainly associated with the spatial
resolution of surface water datasets (i.e., 30 m), which can be
assessed by the linear errors (±0.5 pixels) and the shoreline
length (Nie
et al.,
, 2017; Salerno
et al.,
, 2012; Wang
et al.,
2015). In addition, the relative lake area change was used to
estimate the overall trend of area changes in relatively large
lakes (surface area
≥
10 km
2
) (Tao
et al.
, 2015; Zhang
et al.,
2017a), which can be calculated as:
Relative lake area (%)
=
(
)
×
∑
1
100
n
A A
i
i
s
/
(1)
where
n
is the number of lakes,
A
i
represents the averaged
surface area of
i
th
lake in one of the seven periods (i.e., 1985,
1990, 1995, 2000, 2005, 2010, and 2015), and
A
i
s
denotes the
surface area of the
i
th
lake in the reference period (the average
lake area between 1985 and 2015 is used as the reference).
Relationships Between Lake Changes and Climatic/human Factors
Climatic data were used to document the general trends in air
temperature and precipitation over the entire China during
the past three decades. The monthly temperature and precipi-
tation data from 1985 to 2015 were collected from over 700
meteorological stations (China Meteorological Administration;
/
). Mean annual temperature (MAT) and
mean annual precipitation (
MAP
) for the five lake zones were
calculated using the monthly climate data. The MAT anomaly
and
AMP
anomaly were calculated as the difference between
the temperature or precipitation in a given year and the long-
term average temperature or precipitation over the study pe-
riod, respectively. Human population, irrigation area, grazing
data (number of sheep and goats), mining data (coal produc-
tion), built-up area, and water projects construction (number
of floodgates) for the five lake zones during the period of 1985
to 2015 were documented from statistical year books of Chi-
na’s major provinces, municipalities, and autonomous regions
). These factors were used as indica-
tors of human activities. The glaciated area over China was
derived from the Second Chinese Glacier Inventory, which
was compiled using 218 Landsat
TM
/
ETM+
images mainly from
2006 to 2010 (Guo
et al.,
, 2015). An overview of multi-source
datasets used in this study is shown in Table 1.
To explore the possible driving factors, the relationships
between lake changes and the regional climate and human
activities were investigated. The annual mean temperature
(
AMT
) and precipitation (
AMP
) were calculated as measures
of regional climate. Moreover, irrigation area, human popula-
tion, grazing, coal mining, urban area, and number of flood-
gates were used as indicators of human activities. Correlation
analysis (Spearman’s correlation coefficient) was performed
using
SPSS
Statistics 19 software to understand the association
between the relative lake area and
corresponding climate/human fac-
tors in the five lake zones. The
t
-test
results with
p
<0.01 and
p
<0.05
are reported as strongly significant
and significant, respectively.
Results and Discussion
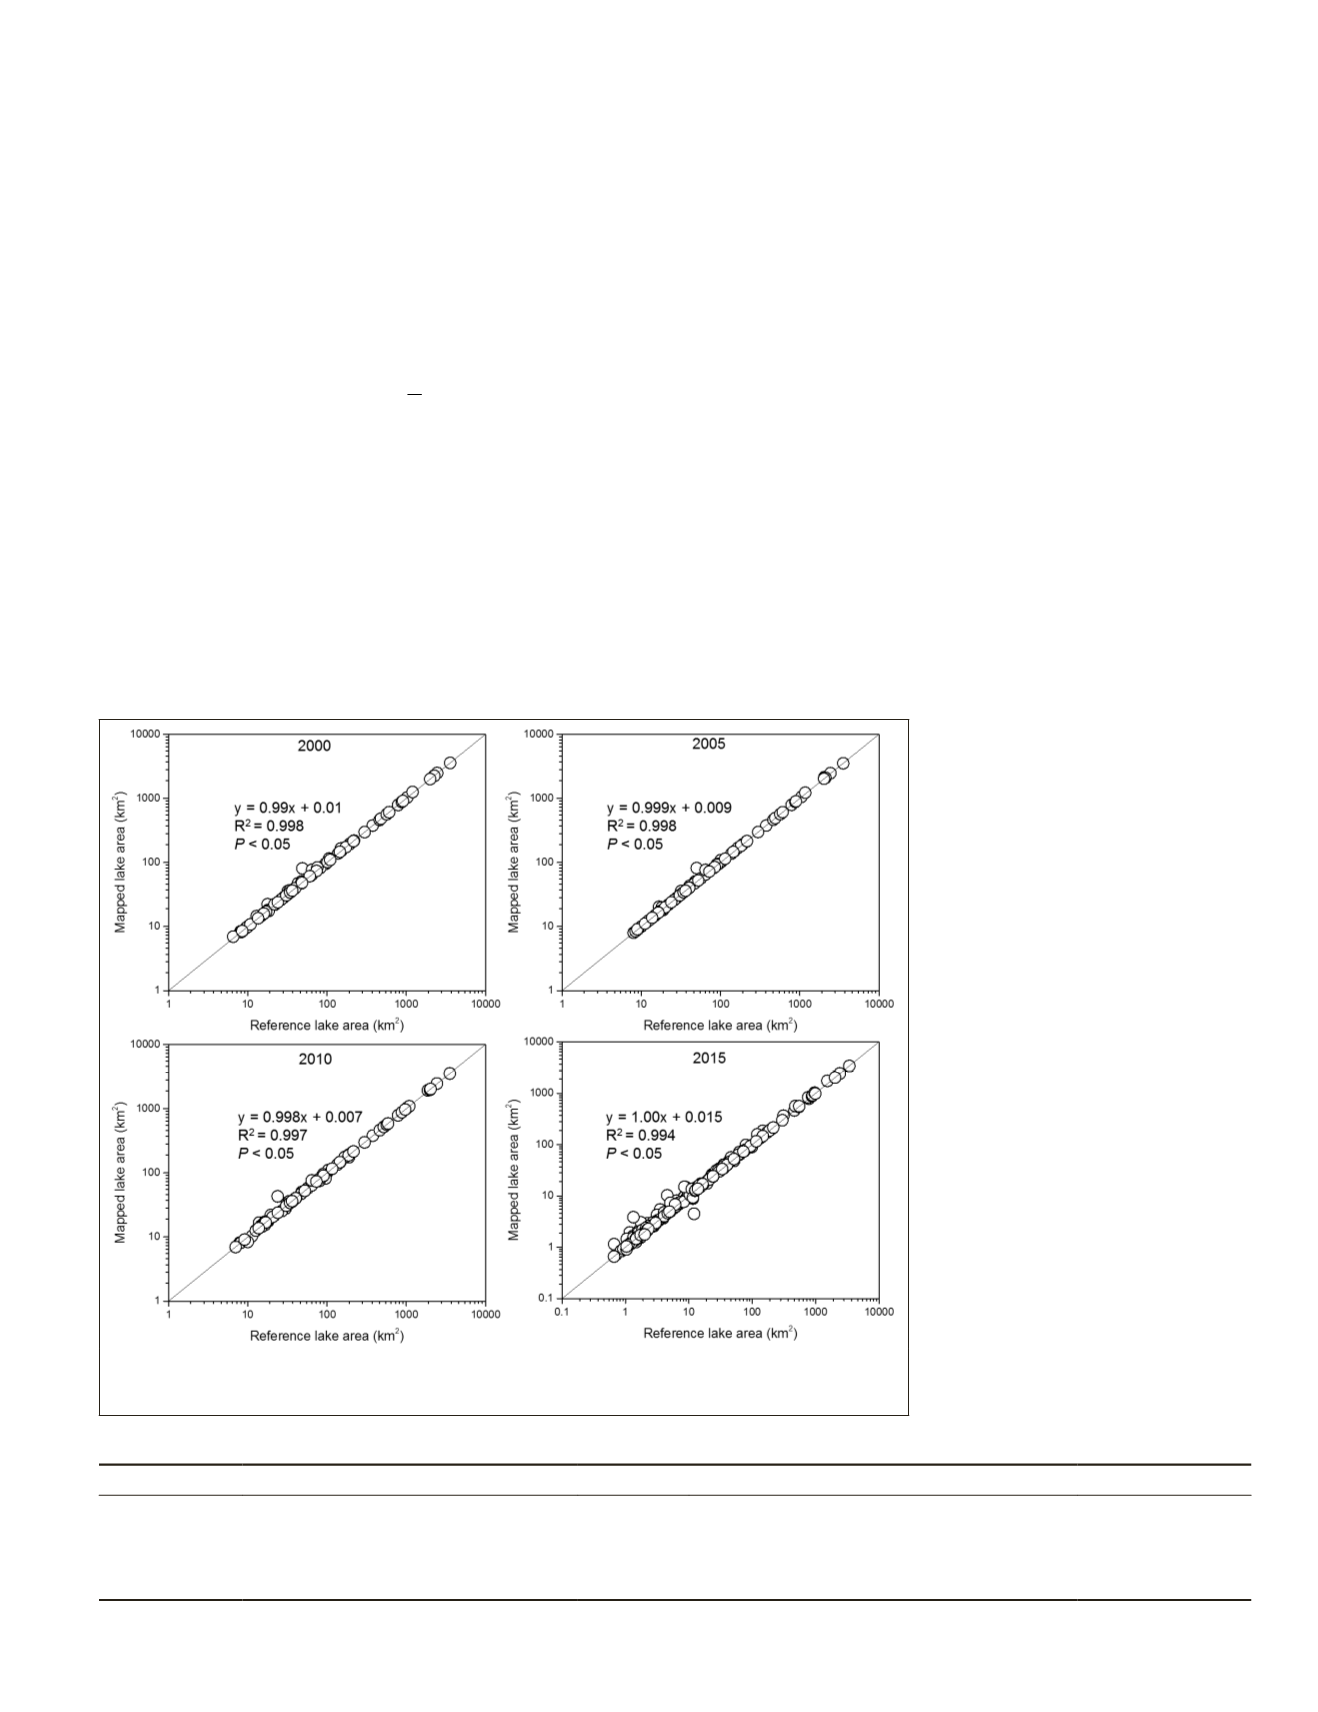
Accuracy Validation and Comparison with
Other Datasets
To assess the accuracy of the
mapped lake area in this study, we
collected the reference lake dataset
by manual digitalization using the
very high-resolution images avail-
able in Google Earth. Since high-
resolution imaging satellites (e.g.,
GeoEye and Ikonos) started acquir-
ing data after the late 1990s, the
reference lake areas for 2000, 2005,
2010, and 2015 were available to
validate the developed lake dataset.
The 300 randomly sampled lake re-
gions (water area
≥
1 km
2
) that rep-
resent the various lake classes and
sizes were selected from our lake
dataset. The comparisons between
our mapped lake area and the refer-
ence lake area for the four episodes
are shown in Figure 2, which
exhibited high linear confidence of
fit (R
2
≥
0.994,
P
<0.05). In addition,
Table 1. Overview of the multi-source datasets applied in this study.
Data category
Data source
Time span
Application in this study
Reference
Surface water
Global surface water datasets
1984–2015 Delineation of China’s multi-temporal lakes (Pekel
et al.,
, 2016)
Glacier area
Second Chinese Glacier Inventory 2006–2010
Extraction of glacier area over China
(Guo
et al.,
, 2015)
Climate
China Meteorological Administration 1985–2015
Measures of regional climate
-
Human activity
Statistical year books
1985–2015
Indicators of human activity
-
Figure 2. Comparisons of the mapped lake area in this study and the reference lake area
delineated from Google Earth high-resolution images for the four episodes (i.e., 2000,
2005, 2010, and 2015).
PHOTOGRAMMETRIC ENGINEERING & REMOTE SENSING
October 2018
659


