Conclusions
The
LFG
error is affected by many factors including the laser
pointing error, the attitude error, the instrument errors, and
the surface slope and roughness. According to the principle
of
LFG
and error propagation, we establish the
RMSE
model of
LFG
caused by random error sources for the
GLAS
considering
compressively all influence factors. To validate the proposed
mathematical model in the paper, we introduce referenced
data containing the waveforms (
GLA01
) and original
LFGs
(
GLA14
) and coincident airborne lidar point cloud at field test.
First, we simulate the effects of surface slope and rough-
ness on the
RMSE
of
LFG
. The simulated results demonstrate
that the horizontal errors maintain at a constant level and the
vertical error ascends proportionally with the increasing of
surface slope and roughness. Moreover, the gradient of surface
slope to vertical error is more sensitive than that of the rough-
ness. As for nine terrains, ranging from low-relief glaciated
continental shield to high-relief convergent mountain front,
horizontal errors are 5.86 m, which mainly caused by the
angle errors from the mounting errors, the laser pointing errors
and the attitude errors; meanwhile, the vertical error dominat-
ed by the laser pointing error increases from 0.07 m to 2.49 m.
Second, we employ the waveform matching method with
coincident airborne lidar point cloud and 20 referenced
measurements at Shaolin Temple of Henan province in China
GLAS
data to calculate the reference
LFGs
as ground truth.
Through eliminating systematical errors, we can obtain the
processed results caused by random error and evaluate them
based on three-standard-deviations principle of error: (1)
all horizontal differences are restricted within three times
horizontal errors, and the corresponding standard derivations
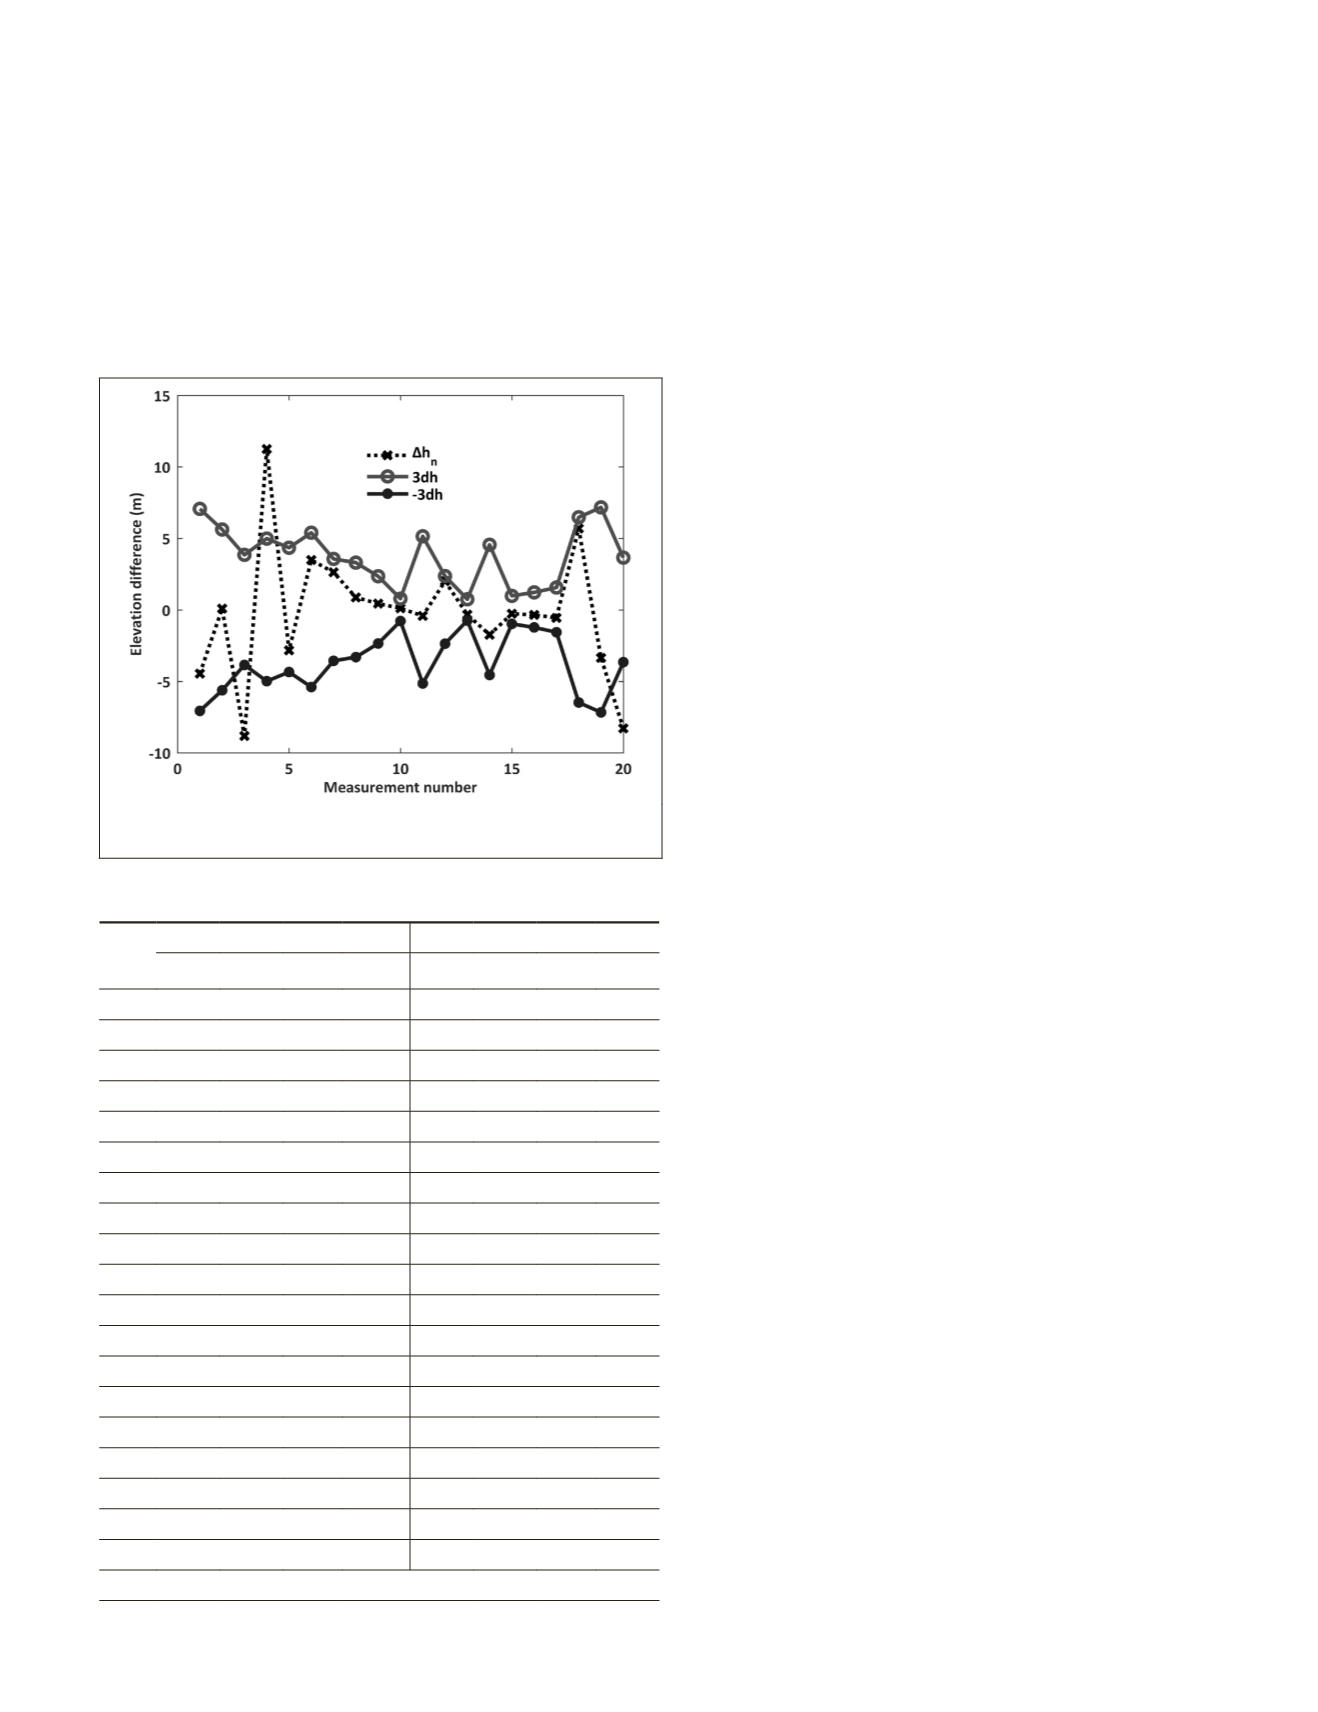
in x-axis and y-axis are 7.56 m and 7.49 m; (2) among total 20
ground truth, 17elevation differences of (85%) are confined
within three times vertical errors, and 3 outliers are generated
because of the incomparability of the surface slope and rough-
ness at systematic offset positions and reference
LFG
. Based
on the above results, we think that the
RMSE
models of
LFG
are
applicable in evaluating performance of the laser altimeter.
Certainly, other factors such as atmosphere delay, clock
synchronization, and solid tides might also impact the
geolocation accuracy additionally, and their influence on the
geolocation error will be investigated on future research.
Acknowledgments
This research was financially supported by the National
Natural Science Foundation of China (41506210), the Na-
tional Science and Technology Major Project (11-Y20A12-
9001-17/18, 42-Y20A11-9001-17/18), and Joint Funds of
Aerospace Science and Technology Advance Research
(B06110102, B06110103). Additionally, the Academy of
Finland projects “Centre of Excellence in Laser Scanning
Research (CoE-LaSR) (307362)” and “New laser and spectral
field methods for in situ mining and raw material investiga-
tions” (project 292648). the Chinese Academy of Science
(181811KYSB20160113), the Chinese Ministry of Science and
Technology (2015DFA70930), and the Shanghai Science and
Technology Foundations (18590712600) are acknowledged.
Appendix
The laser altimeter coordinate reference system (
LARS
) locates
at the laser altimeter. The origin of this system is reference
point where the laser transmits from altimeter to the ground.
The z
l
-axis positive is aligned with nadir direction; x
l
-axis
positive is in the direction of satellite travel; y
l
-axis positive
completes a right-handed Cartesian system.
The laser pointing coordinate reference system (
LPRS
) also
locates at the laser altimeter. The origin and y
m
-axis of this
system are coincident with the laser altimeter coordinate
reference system. The z
m
-axis positive is aligned with laser
beam center line; x
m
-axis positive completes a right-handed
Cartesian system.
The positioning coordinate reference system (
PRS
) centers
at
PS
receiving antenna. The origin of this system is the phase
center of
GPS
antenna. The z
s
-axis positive points downward
toward the center of mass of the Earth; x
s
-axis positive is in
the direction of satellite travel; y
s
-axis positive completes a
right-handed Cartesian system.
Figure 8. The elevation differences and three times vertical
errors for 20 measurements.
Table 5. The terrestrial features at the systematic offset
positions and reference
LFGs
.
Index
Systematic offset position
Reference LFG
s
//
(°) s
^
(°)
σ
h
(m) h (m) s
//
(°) s
^
(°)
σ
h
(m) h (m)
1 33.46 14.73 8.02 865.74 35.48 15.90 9.40 861.28
2 -4.94 -32.15 6.75 783.92 -4.15 -32.26 6.91 784.01
3
27.55 15.90 5.97 807.08 17.63 15.19 3.99 798.26
4
-0.76 -31.54 6.97 748.38 -6.33 -29.02 6.04 759.63
5 8.65 -26.51 7.68 734.16 6.21 -25.24 5.94 731.33
6 19.19 25.60 5.02 734.74 19.29 25.66 5.14 738.23
7 1.78 -20.15 5.67 710.99 0.45 -21.75 5.70 713.62
8 -5.77 -21.87 5.06 674.27 -4.74 -20.09 4.83 675.14
9 5.51 -13.49 4.48 627.55 5.62 -13.22 4.47 627.99
10 3.65 -5.06 3.92 592.73 2.61 -4.13 3.86 592.84
11 14.10 -26.84 9.03 560.22 15.18 -26.36 9.19 559.80
12 -15.99 -4.57 4.95 539.50 -14.49 -5.91 6.33 541.51
13 -3.72 -4.86 3.15 542.21 -2.73 -3.95 2.73 541.88
14 21.43 17.19 4.68 546.31 20.03 18.68 5.01 544.57
15 3.97 3.50 6.08 556.99 3.48 3.01 6.12 556.72
16 -7.00 -2.71 3.04 568.60 -8.32 -1.72 3.88 568.25
17 -8.14 -6.88 3.97 576.39 -7.66 -7.22 3.71 575.83
18 -23.19 8.56 7.29 615.18 -24.51 5.37 7.31 620.87
19 -32.73 25.51 13.17 650.99 -34.94 23.74 12.95 647.63
20
11.01
15.23 2.94 701.10 16.10 15.23 3.61 692.81
PHOTOGRAMMETRIC ENGINEERING & REMOTE SENSING
October 2018
655


