degrees, the basically constant level of
g
r
suggests that surface
roughness is not the primary factor on the vertical error. In
the same way, the average gradient of the vertical error to the
surface slope will diminish linearly with the increasing of the
surface roughness. When the surface roughness varies from 0
m to 15 m, the slight decreasing of
g
s
from 7.87 cm/degree to
6.71cm/degree indicates that the surface slope affects consis-
tently the vertical error with an approximately linear manner.
For depicting the influence of the measured terrain on the
LFG
error, we consider the nine terrains and calculate the cor-
responding horizontal error and vertical error in Table 3. The
total error is the root sum square of all error components.
From the results in Table 3, we can conclude that the angle
errors, originated from the mounting, the laser pointing, and
the attitude, are major factors to determine the horizontal error,
the proportions of which can be observed in Table 2. Mean-
time, laser pointing angle error mostly contributes to the verti-
cal error varying from 82.97% to 95.37% for nine terrains from
glaciated continental shield to convergent mountain front.
Validation Method and Results
Validation Method
To validate the proposed algorithm of
LFG
error, we employ
the data including
GLAS
waveforms and airborne lidar point
cloud to provide the reference position of
GLAS
footprint;
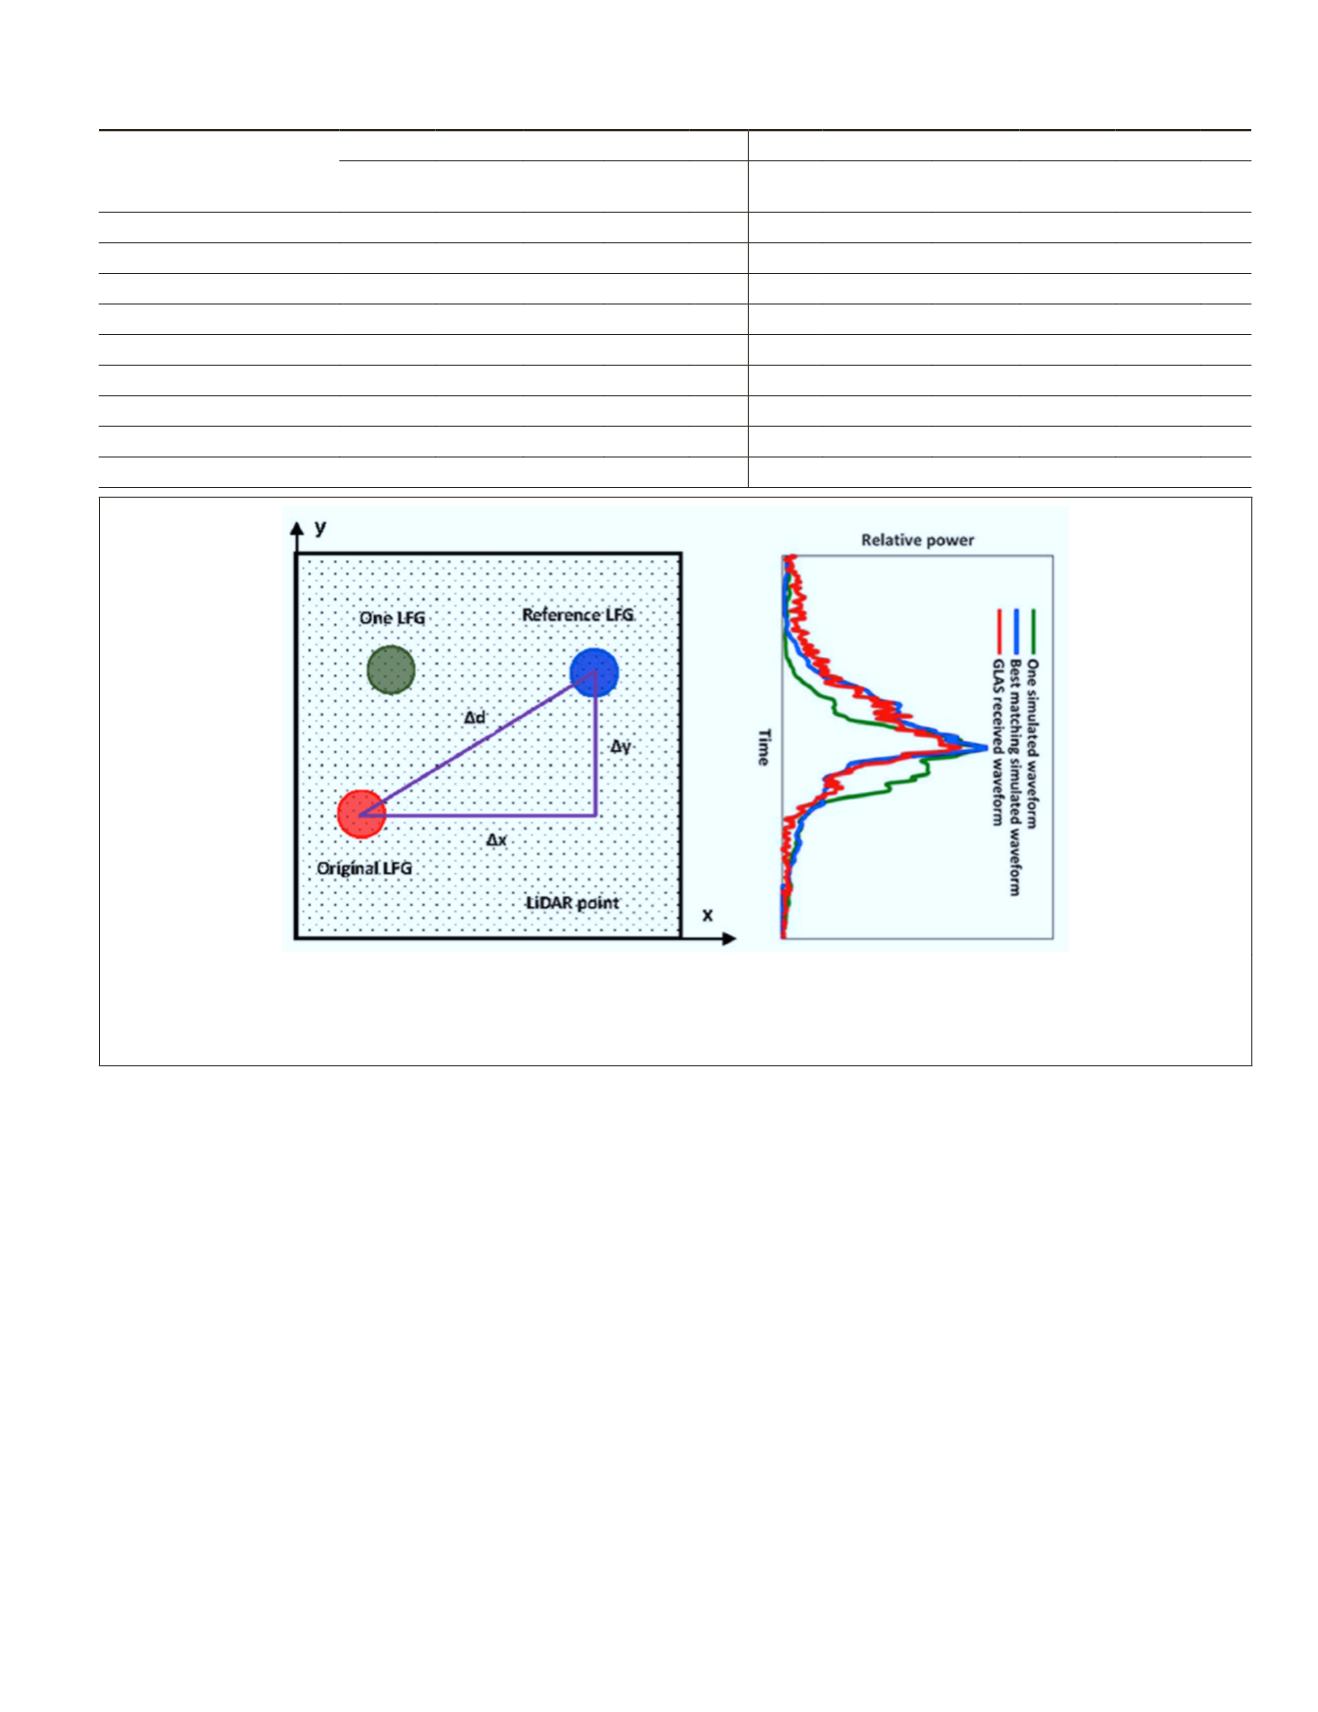
such determination method is based on waveform matching is
shown in Figure 6.
The
GLAS
received waveform is originated from GLA01
data, and simulated waveforms are given by the waveform sim-
ulator and the airborne lidar data, the best-matching position
of laser footprint (reference
LFG
) is resolved based on the posi-
tion where the maximum of the correlation coefficient between
GLAS
waveform and simulated waveform is derived [33].
We describe the reference
LFG
and the original
LFG
with (
x
w
,
y
w
,
h
w
) and (
x
f
,
y
f
,
h
f
) respectively, so the derived difference of
LFG
(Δ
x
, Δ
y
, Δh) can be computed by:
∆ ∆ ∆
x y h x y h x y h
w w w
f
f
f
, ,
, ,
, ,
(
)
=
(
)
−
(
)
.
(24)
If we consider the reference
LFG
as the actual
LFG
, then
the differences can be regarded as the errors of
LFG
. Based
on the surface slope and roughness extracted from airborne
Table 3. The
LFG
error for nine terrains.
Landform
Horizontal error (m)
Vertical error (m)
mounting
error
pointing
error
attitude
error
position
error Total
system
error
broadening
effect
pointing
error
mounting
error
position
error Total
Glaciated continental shield 2.06
2.91
4.65
0.20 5.86 0.05
0.03
0.11
0
0.05 0.13
Shallowly incised drainages
2.06
2.91
4.65
0.20 5.86 0.05
0.07
0.19
0
0.05 0.21
Moderately incised drainages 2.06
2.91
4.65
0.20 5.86 0.05
0.11
0.23
0
0.05 0.26
Ice cap and outlet glaciers
2.06
2.91
4.65
0.20 5.86 0.05
0.07
0.31
0
0.05 0.32
Normal-faulted rift graben
2.06
2.91
4.65
0.20 5.86 0.05
0.17
0.41
0
0.05 0.45
Volcanic complexes
2.06
2.91
4.65
0.20 5.86 0.05
0.20
0.43
0
0.05 0.48
Fold and thrust mountain belt
2.06
2.91
4.65
0.20 5.86 0.05
0.44
1.26
0
0.05 1.33
Deeply incised drainages
2.06
2.91
4.65
0.20 5.86 0.05
0.57
1.59
0
0.05 1.69
Convergent mountain front
2.06
2.91
4.65
0.2 5.86 0.05
0.69
2.20
0
0.05 2.31
Figure 6. The determination of
LFG
using waveform matching method and airborne lidar point cloud. The simulated
waveforms (blue and green curves in the right sub-figure) are generated by the waveform simulator and the lidar data, the raw
waveform (red curve) is the returned signal collected by
GLAS
receiver. The original
LFG
(red circle) is obtained from
GLA14
data, and the best-matching
LFG
(blue circle) is decided by the proposed waveform matching method, and some simulated
LFG
(green circle) is an example of the selected location for the simulator.
PHOTOGRAMMETRIC ENGINEERING & REMOTE SENSING
October 2018
653


