Archinal
et al.
(2015) used
USGS
ISIS
to generate controlled po-
lar mosaics from
LROC NAC
images. The residuals were within
1 pixel with a maximal error of ~7 pixels, and the horizontal
accuracy of the mosaics was within 100 m with respect to the
Lunar Orbiter Laser Altimeter (
LOLA
) data (Lee
et al.
2012).
Wu
et al.
(2014) developed a combined block adjustment
method to process Chang’e-2 stereo imagery and
LOLA
data of
the Chang’e-3 landing area. The resultant
DTM
has an aver-
age elevation difference of 15.19 m and a standard deviation
of 17.08 m compared to that of the
LOLA DEM
. Di
et al.
(2014)
developed a self-calibration bundle adjustment method for
Chang’e-2 stereo images to reduce the geopositioning inconsis-
tencies among the images of adjacent orbits from up to 20 pix-
els to a subpixel level. Kokhanov
et al.
(2017) used a self-devel-
oped photogrammetric method to obtain cartographic products
of potential landing sites for the “Luna-25” mission from 11
LROC NAC
stereo pairs. The bundle adjustment results had pre-
cisions of 0.3 m and 1.0 m in the planar direction and 3.5 m in
the vertical direction. Haase
et al.
(2012, 2014) produced a
DTM
and ortho-mosaic for the Apollo-17 landing site using
LROC NAC
stereo images. The
LROC
-adapted German Aerospace Center
photogrammetric processing chain was used for stereo image
processing, and the resultant
DTM
had a standard deviation of
40 cm in elevational difference with the
LOLA
profiles.
As previously described, existing lunar mapping research
is generally based on stereo images. However, the
LROC NACs
can only acquire stereo images from adjacent orbits using
off-nadir slew in limited interested locations, and most of
the time, the captured
NAC
images have nadir orientation.
There are only a few
NAC
stereo pairs in the Chang’e-5 plan-
ning landing area because the nadir
NAC
images cannot be
used to generate a high-resolution
DOM
mosaic using stereo
photogrammetric methods. Furthermore, most of the existing
studies have been focused on photogrammetric processing in-
volving several or tens of images. For large-area mapping, the
geometric and radiometric inconsistencies are more severe
and complicated. Therefore, it is necessary to develop a more
effective method to produce high-precision
DOM
mosaics for
large areas using nonstereo
NAC
images and a l
source of limited resolution.
This research aimed to develop a systemati
tive method for generating a seamless
DOM
for
Chang’e-5 landing area. In this work, we used a two-step strat-
egy. First, the study area was divided into several overlapped
subareas, and a planar block adjustment with control points
was applied to each subarea to lower the geometric deviations
among the
NAC
images to the subpixel level at the same time
of tying the
NAC
images to the reference
SLDEM2015
. Then a
seamless
DOM
mosaic of each subarea was generated. Second,
the thin plate spline (
TPS
) model (Wahba 1990) was applied
to the subarea
DOMs
to remove the positional inconsistencies
between the adjacent subarea
DOMs
and guarantee seamless
DOM
mosaicking throughout the whole research area. Using
the proposed two-step method, a controlled seamless mosaic
of the Chang’e-5 landing area was created with high geometric
precision and with a resolution of 1.5 m.
Data
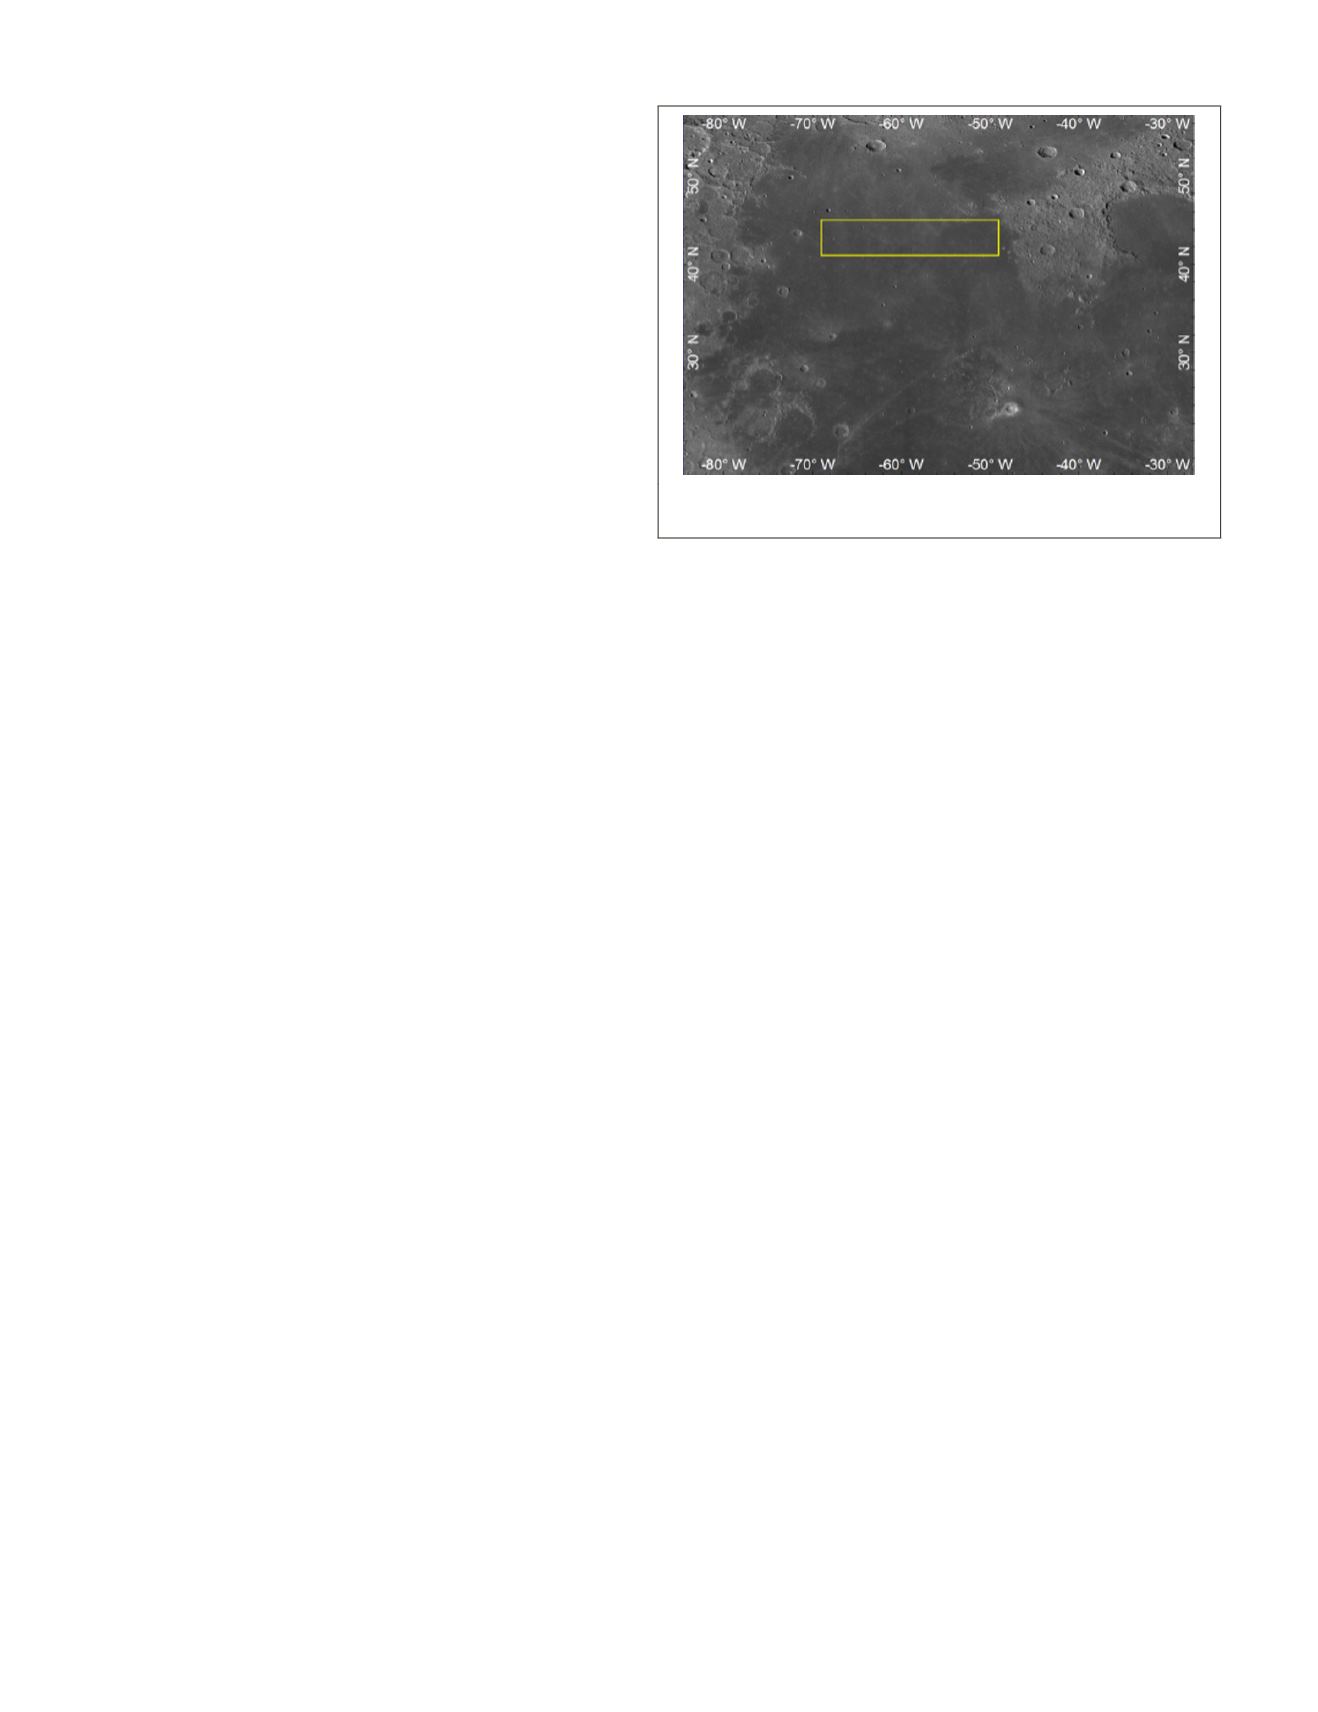
The planned landing area of Chang’e-5 mission was chosen
to verify the proposed large-area
DOM
generation method. It
locates near Mons Rümker within Oceanus Procellarum and
covers an area of approximately 20
°
longitude
×
4
°
latitude, or
approximately 413.8 km
×
121.4 km (Di
et al.
2018).
LROC NAC
images were the data source used in this research.
SLDEM2015
,
a combined product of
LOLA
laser altimetry and
DEMs
generat-
ed from the Japanese Selenological and Engineering Explorer
(
SELENE
) terrain camera images (Barker
et al.
2016), was used
as reference
DEM
for ortho-rectification. Figure 1 shows the
planned landing area of Chang’e-5 on the
LROC WAC
mosaic.
Figure 1. Planned landing area of Chang’e-5 marked as a
rectangle on the
LROC WAC
mosaic.
LROC NAC Images
The
LROC
is a system of three cameras onboard the Lunar
Reconnaissance Orbiter (
LRO
) that captures high-resolution
monochromatic images and moderate-resolution multispectral
images of the lunar surface. It consists of two
NACs
that are
designed to provide 0.5–2.0 m/pixel monochromatic narrow-
angle line scan images and a
WAC
that provides images at a
scale of 100 m/pixel in seven color bands over a 60-km swath
(Robinson
et al.
2010).
NAC
Experimental Data Record images were downloaded
from the
NASA
Planetary Data System (PDS) and preprocessed
using the
USGS
ISIS
software.
SPICE
kernels (NAIF 2014) were
attached to each image using the “spiceinit” command, and
radiometric corrections and removal of echo effects were
realized by the “lronaccal” command and the “lronacecho”
command, respectively (PDS 2014; Henriksen
et al.
2016).
Until December 2017, the planned Chang’e-5 landing area is
299
LROC NAC
images. Considering the illu-
s, most of the chosen images have similar
s that are higher than 180
°
(afternoon im-
ages) and incidence angles between 40
°
and 80
°
. The planned
landing area could not be completely covered with afternoon
images, so small gaps were filled with one or two morning im-
ages. A total of 765
NAC
images were involved in this research
with a ground sample distance of mainly 1.5 m.
Control Source
SLDEM2015
was used as the control source for providing three-
dimensional control points in the block adjustment stage as
well as providing topographic correction during
DOM
gen-
eration. This product is a lunar shape model generated by a
combination of
LOLA
and
SELENE
data. This includes 43 200
stereo-derived
DEMs
from
SELENE
Terrain Camera images and
4.5 billion surface heights from
LOLA
(Barker
et al.
2016). The
resultant near-global lunar
DEM
has an effective resolution
of approximately 60 m at the equator and a typical vertical
accuracy of approximately 3–4 m. In addition, the
LROC WAC
mosaic (
NASA
2011; Wagner
et al.
2015) was used as a refer-
ence for grayscale balancing in the image mosaicking process.
Method for Large-Area Controlled DOM Generation
In this research, a two-stage method was used to generate a
large-area controlled seamless
DOM
. Figure 2 is the flowchart
showing the generation process of large-area seamless
DOM
. To
guarantee both the processing efficiency and mapping preci-
sion, the large landing area was partitioned into 10 subareas
and processed in parallel. Dividing the whole mapping area
into some subareas is a common strategy when dealing with
482
July 2019
PHOTOGRAMMETRIC ENGINEERING & REMOTE SENSING


