TPS-Based DOM Registration Results
Due to the limited resolution of the
SLDEM2015
compared with
the
LROC NAC
images, geometric inconsistencies still exist
between the seamlessly mosaicked adjacent subarea
DOMs
.
The upper two subfigures in Figure 7 show examples of the
geometric inconsistencies between Part 1 and 2 as well as Part
9 and 10 mosaicked
DOMs
, which were effectively reduced
by the image registration process based on the
TPS
model as
indicated in subfigures (c) and (d) in Figure 7. The registra-
tion was conducted subarea by subarea using the proce-
dure detailed in the section “
TPS
-Based Large-Area Image
Registration.”A quantitative evaluation of the registration re-
sults can also be realized by measuring the differences of the
check point pair coordinates between any two overlapping
subarea
DOM
mosaics. Parts 1 and 2 are taken as examples.
Ten evenly distributed check point pairs were automatically
matched in the overlapping region, as shown in Figure 8.
The deviations of the check point coordinates in the latitu-
dinal and longitudinal directions are listed in Table 4. After
the
TPS
-based registration, the planar deviations are reduced
to about 1 pixel, and the largest difference is 2.69 m, which is
no more than 2 pixels of the output
DOM
, reflecting a high-
precision registration.
Landing Area DOM and Potential Applications
After subarea planar block adjustment and
TPS
-based image
registration of the subarea
DOMs
, a seamless
DOM
mosaic of
the entire Chang’e-5 planned landing area was produced. The
generated radiometrically homogeneous and geometrically
seamless
DOM
mosaic is shown in Figure 9 (zoomed-out view).
This final
DOM
mosaic has the image size of 224 721 columns
and 44 945 rows with a ground sample distance of 1.5 m.
This high-resolution 10-gigapixel
DOM
has many potential
applications for detailed morphological and geological stud-
ies. For example, using the high-resolution map, craters can
be precisely measured to determine the age of surface units
(Michael and Neukum 2010); small, particularly fresh craters
(e.g., flat-bottomed, central-mound, and concentric craters)
can be used to estimate the depth of the lunar regolith (Bart
et
al.
2011; Di
et al.
2016); rocks/boulders on the ejecta of a cra-
ter can be identified and the spatial density used to estimate
the formation time of the crater (Li
et al.
2017); and so on.
More important, distribution pattern analyses of crater rays,
crater chains, and boulders are significant in helping identify
source locations of the exposed features (e.g., rock and soil
samples to be collected by the lander), which will directly
contribute to the major scientific objective of the sample
return mission.
(a)
(b)
(c)
(d)
(e)
(f)
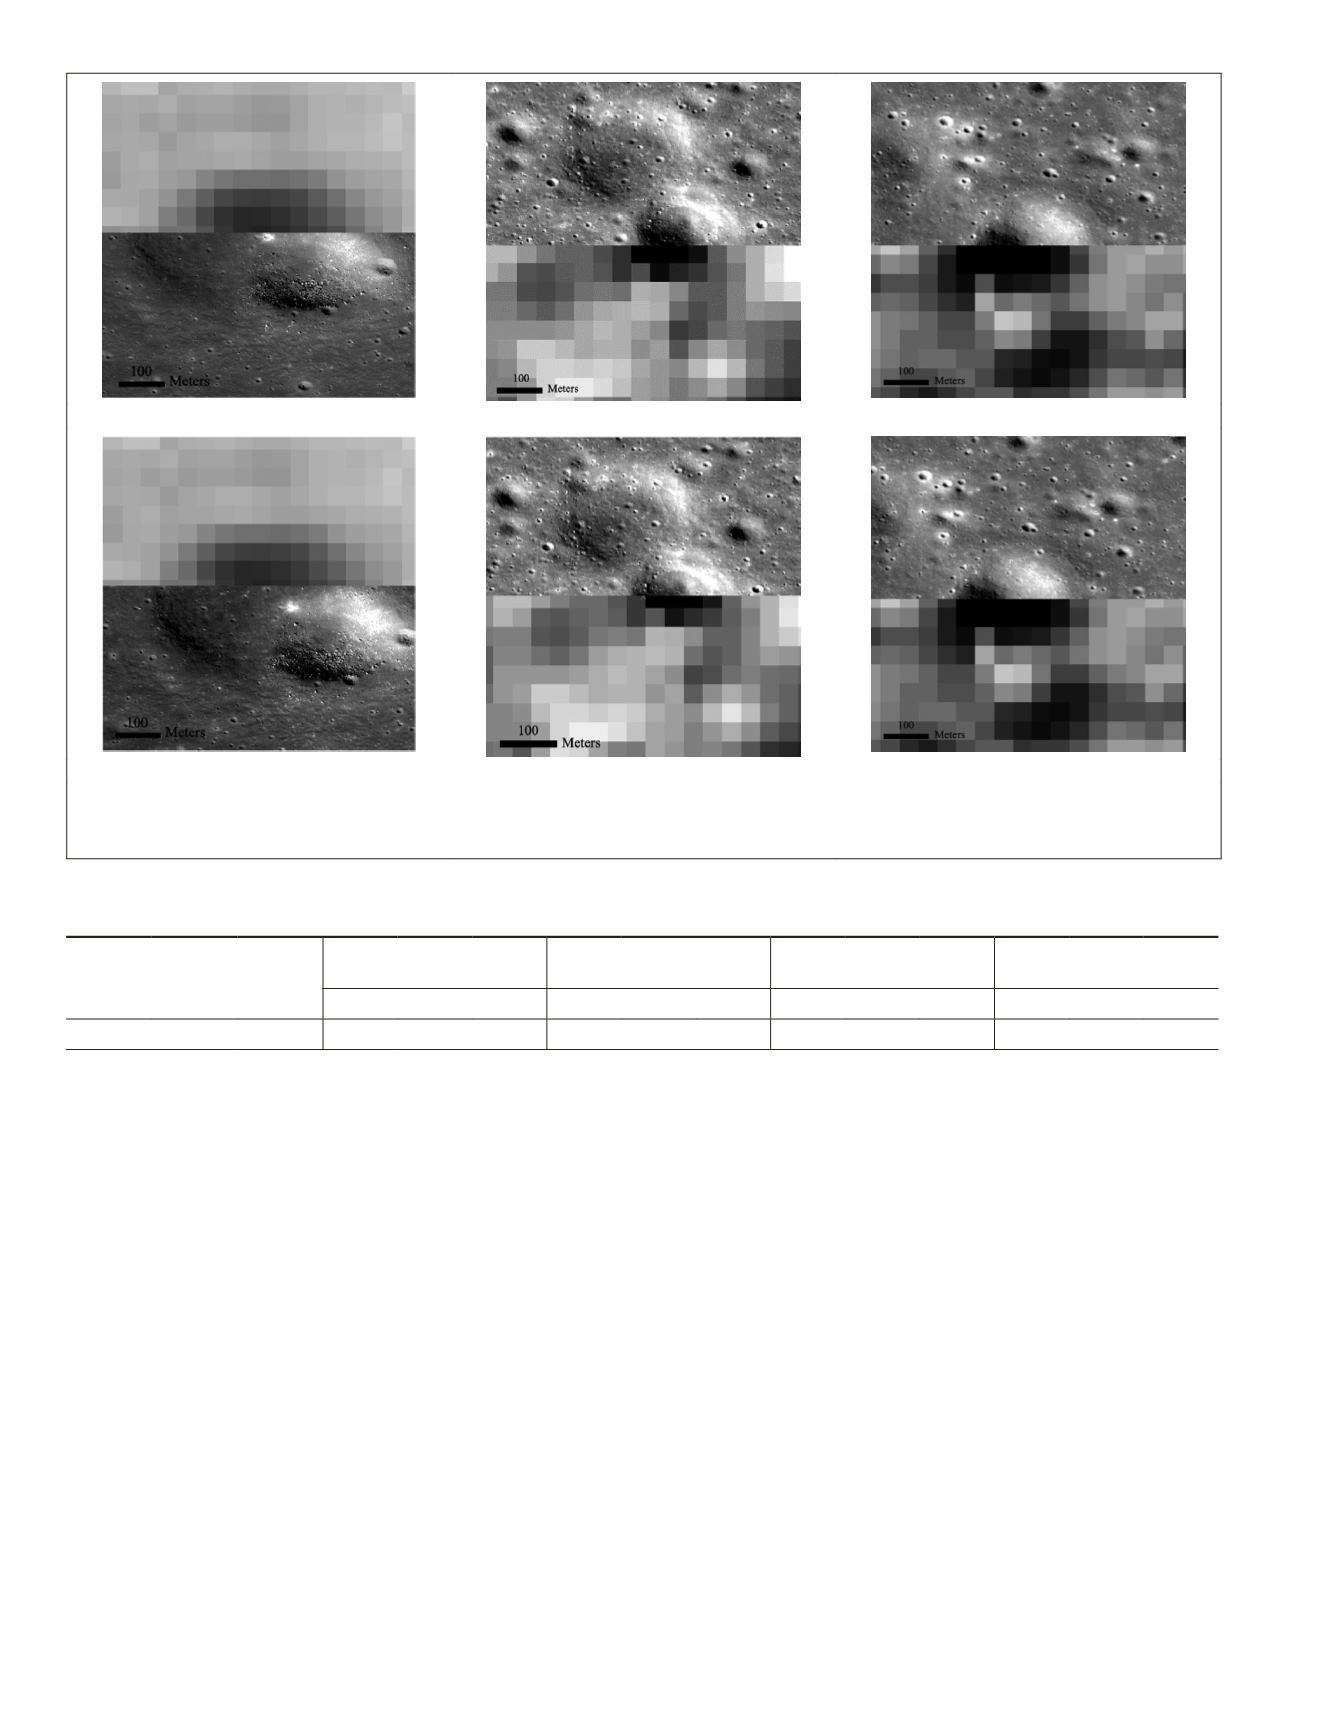
Figure 6. The geometric differences between
NAC DOMs
and
SLDEM2015
before (upper three) and after (lower three) the
planar block adjustment. The
NAC DOMs
in subfigures (a) and (d) are part of m1221740903r in Part 1, (b) and (e) are part of
m1175809506l in Part 5, and (c) and (f) are part of m1145135367l in Part 10.
Table 3. Image numbers, control point, and tie point numbers and control point and tie point precisions of the overall block
adjustment using all the selected NAC images involved in the subarea block adjustment. The unit for precision assessment is an
NAC
image pixel assumed to be 1.5 m.
Image
Number
Control
Point
number
Tie
Point
Number
RMS Errors of Co
Points (Pixel)
MS Errors of
ie Point (Pixel)
Maximum Errors of
Tie Point (Pixel)
x
y
y
xy
x
y
xy
750
95 437 999 23.69 26.13 35.27 49.87 78.93 93.37 0.27 0.37 0.46 0.94 5.62 5.7
488
July 2019
PHOTOGRAMMETRIC ENGINEERING & REMOTE SENSING


