of the auxiliary control point remain unchanged. Other coor-
dinates in the target
DOM
were smoothly transformed using
the calculated
TPS
coefficients.
The whole registration process can be implemented simul-
taneously with all the control points matched in advance. To
be specific, the homologous points between every two subarea
DOMs
are obtained first as reference or auxiliary control points.
These control points will be unchanged during the whole reg-
istration process. Then the
TPS
model for every target
DOM
is es-
tablished in parallel with the achieved control points. Thus, the
registration of every target
DOM
can be implemented indepen-
dently and simultaneously. Finally, the
DOM
mosaic of the entire
landing area was generated in high geometric consistency.
Results and Analyses
Planar Block Adjustment Results
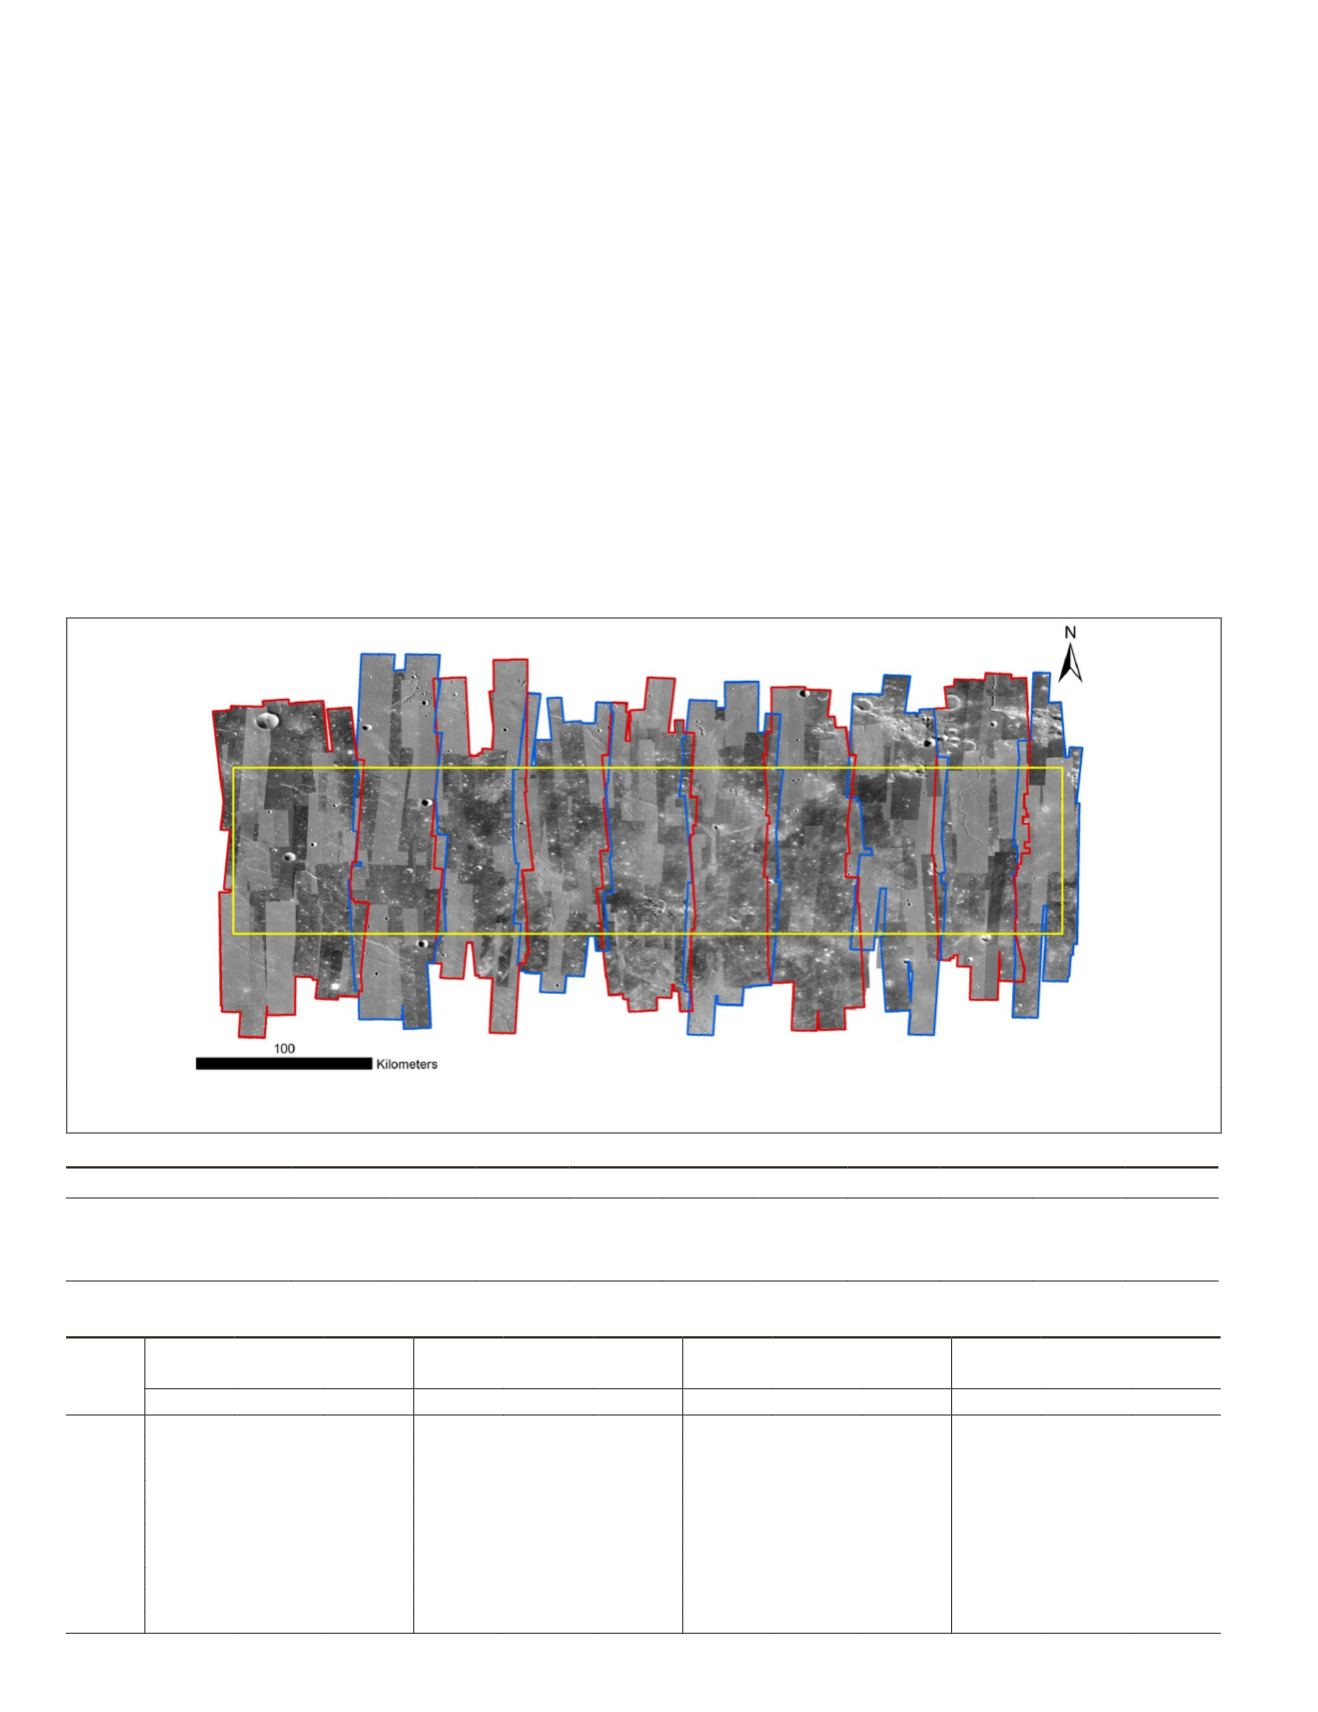
The whole planned Chang’e-5 landing area was partitioned into
10 subareas in longitude. The subareas covered approximately
3
°
in longitudinal direction with an overlap of 1
°
. The 10 subar-
eas from left to the right were named Parts 1 to 10. The quantity
of
LROC NAC
images in every subarea is displayed in Table 1
together with the control point and tie point numbers for the
planar block adjustment. The borders of each subarea overlap-
ping on the selected
NAC
images are depicted in Figure 4.
The planar block adjustment was performed on the 10
subareas separately, and the results are shown in Table 2.
The unit of all the precision assessment results is one
NAC
image pixel, which is set to be 1.5 m in this research. The
control point precision was evaluated in image space by the
RMS errors between the back-projected coordinates and the
measured-image coordinates. As shown in Table 2, the RMS
errors for the control points are approximately 27
NAC
image
pixels on average, which is about one grid cell size of the
SLDEM2015
in the research area, with the maximum error no
more than two grid cell size, reflecting that the subarea
DOMs
are connected well to the
SLDEM2015
. As for the tie points, the
RMS errors were also measured by the difference between
the matched image coordinates and the back-projected image
coordinates. The RMS errors of tie points, as shown in Tables
1 and 2, are approximately one-half of an
NAC
image pixel in
every part, which indicates that the geometric consistencies
of
NAC
images in the subareas were effectively improved after
planar block adjustment.
Figure 4. Footprints of all the selected
LROC NAC
images and the borders of the 10 subareas. Red and blue colors are used
alternately for distinguishing the subarea borders. The yellow rectangle represents the planned landing area of Chang’e-5.
Table 1. Image numbers, control point, and tie point numbers in the ten subareas.
Subarea ID
Part 1 Part 2 Part 3 Part 4 Part 5 Part 6 Part 7 Part 8 Part 9 Part 10
Image number
111
71
73
56
93
84
74
54
85
49
Control point number
8
10
11
10
9
11
11
8
9
8
Tie point number
46 386 39 279 49 005 47 174 48 243 48 253 51 425 35 485 41 601 31 148
Table 2. Control point and tie point precisions of the planar block adjustment in ten subareas. The unit is an
NAC
image pixel
assumed to be 1.5 m.
Subarea
ID
RMS Errors of
Control Points (Pixel)
Maximum Errors
of Control Points (Pixel)
RMS Errors of
Tie Point (Pixel)
Maximum Errors
of Tie Point (Pixel)
x
y
xy
x
y
xy
x
y
xy
x
y
xy
Part 1
13.10
19.41
23.42
1.71
38.42
38.46
0.33
0.48
0.58
0.33 −3.31
3.33
Part 2
19.18
21.75
29.00
27.49
−25.76
37.68
0.37
0.45
0.58
0.75 −2.84
2.93
Part 3
17.75
19.81
26.60
21.92
37.94
43.82
0.46
0.62
0.77
0.11 −2.83
2.83
Part 4
17.70
13.23
22.10
34.60
9.24
35.81
0.17
0.30
0.34 −0.33
1.43
1.47
Part 5
18.71
13.71
23.20
32.50
3.14
32.65
0.16
0.18
0.24
2.80
0.24
2.81
Part 6
17.08
13.04
21.49
17.07
−21.94
27.80
0.23
0.36
0.43
2.53 −0.26
2.54
Part 7
23.44
15.52
28.11
40.90
11.76
42.56
0.26
0.38
0.46 −1.85
1.10
2.15
Part 8
32.13
19.30
37.48
43.67
−35.92
56.54
0.41
0.43
0.59 −3.40
1.50
3.72
Part 9
36.41
8.10
37.30
40.78
−11.34
42.33
0.26
0.21
0.33
2.45
0.50
2.50
Part 10 19.37
15.39
24.74
36.83
−13.60
39.26
0.25
0.51
0.57
0.50 −2.75
2.80
486
July 2019
PHOTOGRAMMETRIC ENGINEERING & REMOTE SENSING


