The error equations for control points are shown in Equa-
tion 10, and only the affine transformation parameters need to
be calculated for control points:
v
F
e
e
F
e
e
F
e
e l
v
F
f
f
F
f
x
x
x
x
x
y
y
y
=
∂
∂
⋅
+
∂
∂
⋅
+
∂
∂
⋅
−
=
∂
∂
⋅
+
∂
∂
0
0
1
1
2
2
0
0
1
∆
∆
∆
∆
⋅
+
∂
∂
⋅
−
∆
∆
f
F
f
f l
y
y
1
2
2
(10)
The error equations of each control point and tie point can
be constructed using Equations 9 and 10. The unknown param-
eters can be calculated iteratively using the least-squares algo-
rithm until the termination condition of iteration is satisfied.
In this research, the planar block adjustment was con-
ducted in each subarea independently. Using the
RPCs
and the
calculated affine transformation parameters, the
NAC
images
were ortho-rectified with respect to
SLDEM2015
, through which
the image distortions caused by topographic relief and the
imprecision of the original
EO
parameters were simultaneous-
ly corrected. Finally, the subarea seamless
DOM
mosaic was
produced using the individual
DOMs
within the subarea.
TPS-Based Large-Area Image Registration
The planar block adjustment can remove the geometric devia-
tions among images within each subarea, but inconsistencies
remain among the subarea
DOM
mosaics because of the lim-
ited control precision. Therefore, registration between subarea
mosaics is needed to eliminate the residual geometric incon-
sistencies. We propose a novel method of
TPS
model–based
large-area image registration to seamlessly register the subarea
DOMs
while simultaneously maintaining mapping accuracy.
The
TPS
model is an effective technique for data interpo-
lation and smoothing and has been widely used in image
alignment, shape matching, image warping, spatial data
interpolation, and other circumstances that require the
modeling of nonrigid deformation. As shown in Equation 11,
the
TPS
model consists of an affine transformation model and
a distance-related quantity that indicates t
the control point on the interpolation point
distance between them:
f x y
x y
r
j
j
j
m
( , )
( )
( )
= + + +
=
∑
α α α
δ ψ
0 1
2
1
(11)
where the quantity of control points are represented by
m
and
r
j
is the Euclidean distance from the
j
th control point (
x
i
,
y
i
) to
an arbitrary image point (
x
,
y
) as follows:
r
x x y y
j
j
j
= − + −
(
) (
)
2
2
(12)
where
ψ
is the radial-basis-function kernel
ψ
( )
( ),
,
r
r log r r
r
=
≠
=
2
0
0 0
(13)
and
α
0
,
α
1
,
α
2
, and
δ
j
in Equation 12 are the coefficients that
should be calculated by minimizing the weighted sum of the
error measure E(f) (Equation 15) and roughness measure
R
(
f
)
(Equation 16) (Di
et al.
2018) as follows:
min(E(
f
)+
λ
R
(
f
))
(14)
E f
z f x y
j
i j
j
m
( )
,
( )
=
−
(
)
=
∑
1
2
(15)
R f
f
x
f
x y
f
y
( )
=
∂
∂
+
∂
∂ ∂
+
∂
∂
2
2 2
2
2 2
2
2 2
2
2
∫∫
dxdy
(16)
where
λ
represents a smoothing parameter that is required to
be nonnegative. If
λ
= 0, there will be no smoothness con-
straint, and all the control points are exactly passed through
when fitting the
TPS
model. Otherwise, if
λ
= +
∞
, the coef-
ficient
δ
becomes a zero vector, and the
TPS
model will turn
into an affine transformation model (Shen
et al.
2017). The
variable
λ
was set to be zero in our experiment so that the
registration precision can reach as high a level as possible for
the control point pairs and the surrounding area. It is also a
guarantee for the subsequent registration process to be imple-
mented simultaneously.
When registering the subarea
DOMs
with the
TPS
model, a
subarea
DOM
in the central part of the whole area was used as
the reference for neighboring
DOMs
. Then the registered
DOMs
become new references for subsequent subarea mosaics until
all the subarea
DOMs
are registered.
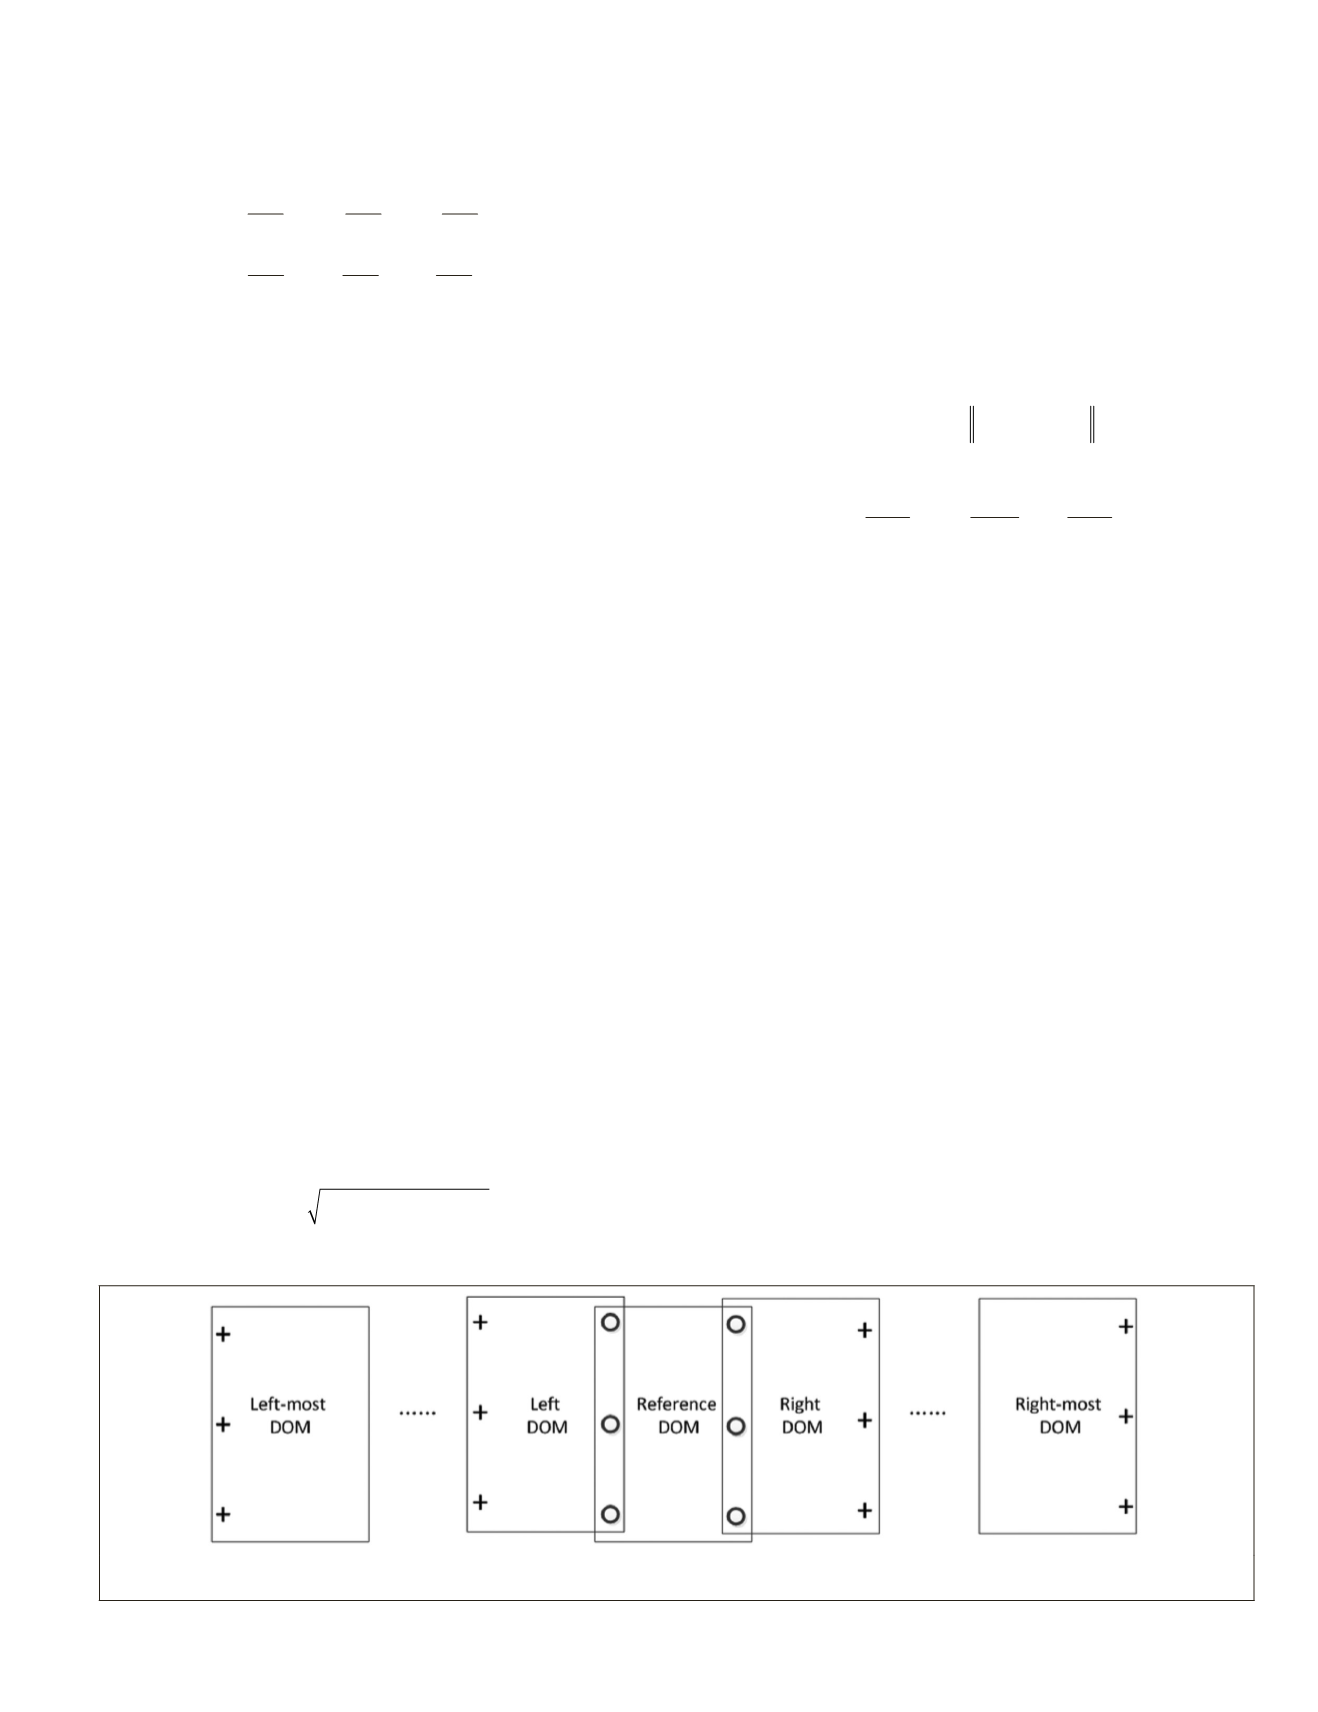
stration, the
TPS
coefficients are calculated by
erence control points and auxiliary control
rence control points are the matched points
get
DOM
and the reference
DOM
, while the
auxiliary control points are on the opposite-side margin of
the target
DOM
, which are introduced to constrain the geo-
metric error in the local area and avoid overcorrection of the
DOM
. For example, in Figure 3, the subarea
DOM
labeled “Left
DOM
” needs to be registered to the “Reference
DOM
,” so the
reference control points were on the right margin of the “Left
DOM
,” shown as circles, while the auxiliary control points
were marked as crosses and distributed on the left margin of
the “Left
DOM
.” Consequently, when solving
TPS
coefficients,
the reference control point coordinates of the target
DOM
were
corrected with respect to the reference
DOM
. The coordinates
Figure 3. Schematic diagram of the
DOM
registration process based on
TPS
model. The reference control points are marked as
circles, and auxiliary control points are shown as crosses.
PHOTOGRAMMETRIC ENGINEERING & REMOTE SENSING
July 2019
485


