After planar block adjustment, the
DOMs
of the
NAC
im-
ages were automatically generated via ortho-rectification. The
block adjustment results can also be assessed by the geometric
deviations between these
DOMs
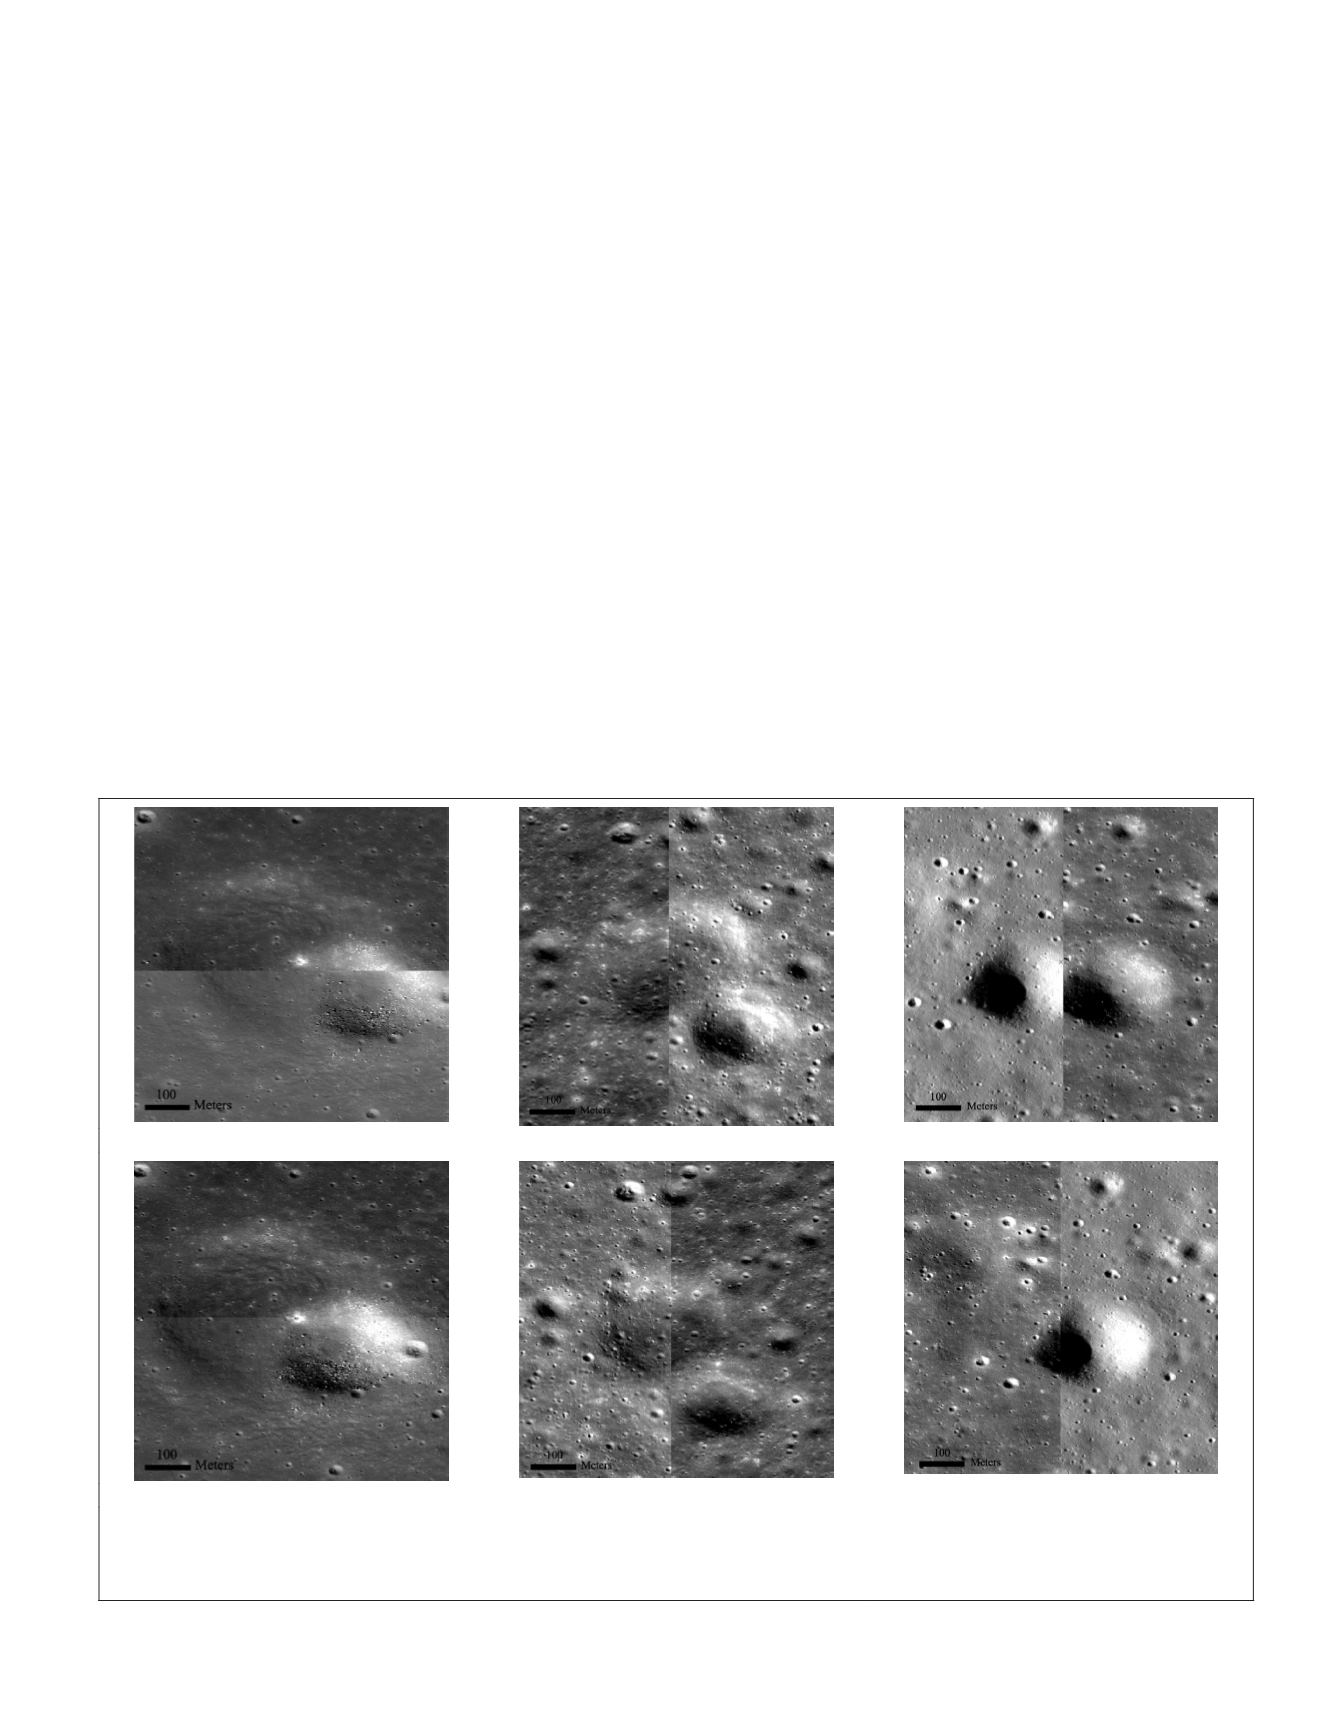
. Figure 5 displays three exam-
ples of the positional deviations of two neighboring
NAC DOMs
before and after block adjustment. The upper three subfigures
show parts of the
DOMs
rectified using the original
RFMs
, while
the lower three are the
DOMs
produced from the same images
but with the block adjustment–refined
RFMs
. The three groups
of examples come from Part 1 ((a) and (d)), Part 5 ((b) and (e)),
and Part 10 ((c) and (f)), respectively. It can be seen that in
subfigures (a), (b), and (c) that there exist up to 100-m geo-
metric deviations that are almost completely removed by the
block adjustment as depicted in subfigures (e), (f), and (g).
Figure 6 compares the positional differences between
NAC DOMs
and
SLDEM2015
before (subfigures (a), (b), and (c))
and after (subfigures (d), (e), and (f)) the planar block ad-
justment. The
NAC DOMs
in subfigures (a) and (d) are part of
m1221740903r in Part 1, (b) and (e) are part of m1175809506l
in Part 5, and (c) and (f) are part of m1145135367l in Part
10. It can be seen that the geometric differences before block
adjustment are about two grid sizes of the
SLDEM
. After block
adjustment processing, these deviations are almost completed
corrected with the manually selected control points.
Seamless
DOM
mosaics were generated for each subarea
via the process of planar block adjustment, image ortho-
rectification, grayscale balancing, and final
DOM
mosaicking.
The
LROC WAC
mosaic product was chosen as the reference for
histogram matching–based grayscale balancing. Most of the
time, the seam lines were automatically extracted. However,
if two adjacent images had obvious illumination difference,
the seam lines would need some manual editing to guarantee
natural transition of the grayscale.
Overall Block Adjustment Evaluation
Although mapping with partitions is widely used when deal-
ing with a large amount of data or large-area mapping, there
is little research on the evaluation of the attainable accuracy
between the overall block adjustment and the subareas block
adjustment. In this article, we gave a specific analysis on this
issue using
LROC NAC
images in our study area.
The block adjustment using the same control points and tie
points of the subarea blocks was performed with all the im-
ages involved in the subarea block adjustment, the results of
which are shown in Table 3. It demonstrates that the RMS er-
rors of tie points can achieve subpixel-level accuracy in both
subarea and overall block adjustment in our study case. But
the maximum error of the tie points from the overall adjust-
ment is almost twice the maximum errors from the subarea
block adjustment. This indicates that a partition can improve
the quality of
DOM
and mosaicking products. Both RMS and
maximum errors show that the precision at control points
decreased remarkably. This may be partially due to the insuf-
ficient precision of control points selected from a lower-reso-
lution reference. To rectify the orbital images to the reference
DEM
for synergetic analysis of different data sets in further
applications, the orbital images should be well coregistered
to the reference
DEM
. In this perspective, the partition strategy
for planar block adjustment is meaningful and effective.
(a)
(b)
(c)
(d)
(e)
(f)
Figure 5. The geometric consistency comparisons between two neighboring
DOMs
. The upper three subfigures are the
DOMs
generated using original
RFMs
, and the lower three are the
DOMs
rectified by the planar block adjustment refined
RFMs
.
Subfigures (a) and (d) are part of m1221740903r and m1191136940l in Part 1, (b) and (e) are part of m1208769920r and
m1175809506l in Part 5, and (c) and (f) are part of m181502892le and m1145135367l in Part 10.
PHOTOGRAMMETRIC ENGINEERING & REMOTE SENSING
July 2019
487


