Diameter Distribution
The distributions of
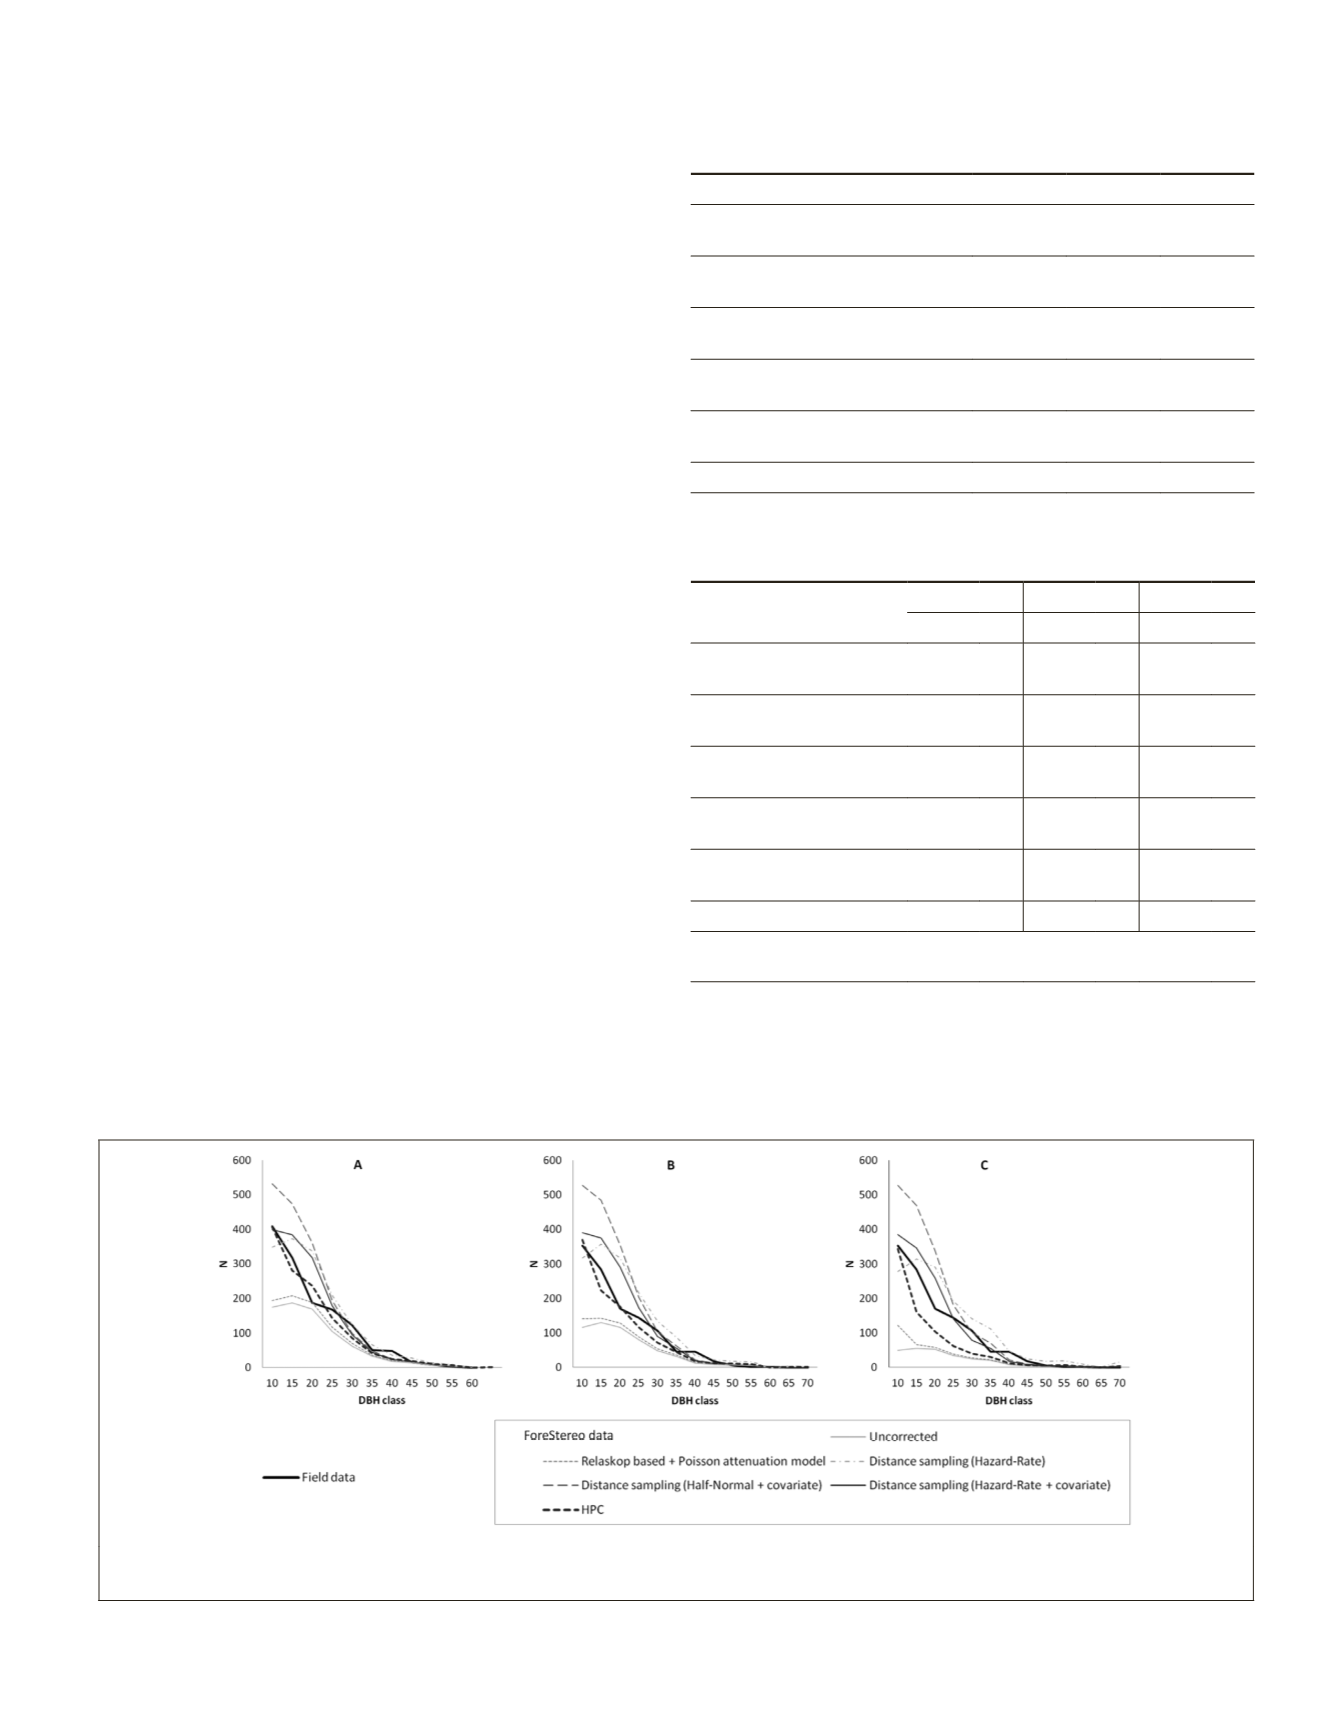
DBH
derived from field data and from For-
eStereo estimates are compared in Figure 10. The histograms
derived from ForeStereo estimates without correction and
those corrected using Relaskop-based estimation combined
with the Poisson attenuation model are similar; tending to
underestimate the number of trees by diameter class, especial-
ly for the smaller diameters (0.075 m–0.125 m class) and in
larger plots. The majority of approaches correcting instrument
bias and tree occlusions improved the noncorrected estimates
and had lower quadratic-form distances than the field mea-
sured distribution (Table 2). The distance-sampling method
using Hazard-Rate function without covariate underestimates
the smallest diameter class (0.075 m) and overestimates
classes over 0.125 m. As observed in Figure 8, the globally
adjusted distance distribution function
g
(
r
,
θ
) for the Hazard
Rate model without covariate is influenced by the distance
distribution of the smaller classes, which are not detected at
long distances. This may be the reason for the overestimation
of the detection probability of larger trees at greater distances,
leading to an over-correction for these trees. This problem is
solved when
DBH
is included as covariate. The distance-sam-
pling with Half-Normal function overestimates the number of
trees with
DBH
< 0.275 m as a consequence of the underesti-
mation of the detection probability for these diameter classes,
shown as a flattening of the
r
*g(
r
,
θ
) curve (Figure 8). When
DBH
is included as covariate, the distance-sampling with
Hazard-Rate function results in a diameter distribution with
greater similarity to the diameter distribution measured in the
field—as assessed by the quadratic form distance—when the
maximum sampling distance is 9.8 or 15 m (Table 2).
The
DBH
distribution obtained with
HPC
showed the closest
agreement with field data measured in 8 m plots and the over-
all minimum quadratic form distance (Table 2 and Figure 10).
When the distance was increased to 15m
HPC
underestimated
the density of most
DBH
classes (Figure 10, right).
Basal Area
BA
was underestimated in the majority of p
rection was applied to the sample of detect
11). The degree of underestimation is great
with high values of
BA
and for large maximum sampling
distances. Relaskop-based estimations with the Poisson at-
tenuation correction reduced the estimate bias from 35% to
28% (Table 3). Distance-sampling using the Hazard-Rate func-
tion without covariate and with Half-Normal function with
ed in a notable overestimation of
BA
. However,
this method showed better results in terms of bias when the
detection function used was the Hazard-Rate with covariate
(4%–11%). The
HPC
method with 8 m plots slightly underes-
timated
BA
(-8%) but showed the highest Pearson correlation
Table 2. Quadratic form distance between the
DBH
histograms
derived from the field data and the
DBH
histograms derived
from ForeStereo data in plots of 8 m, 9.8 m, and 15 m radius
R
.
R
= 8 m
R
= 9.8 m
R
= 15 m
ForeStereo sample
without correction
501.84 561.57 854.03
Relaskop sampling +
Poisson attenuation model
425.53 497.09 762.19
Distance-sampling with
Hazard-Rate function
209.07 319.80 273.75
Distance-sampling with
Hazard-Rate function + covariate
78.50
78.96 139.26
Distance-sampling with
Half-Normal function+ covariate
424.35 583.97 543.91
HPC
72.65
117.22 373.75
Table 3. Bias (
ME
) and Pearson coefficient (r) between measured
and estimated basal area (m
2
/ha) in plots of 8 m, 9.8 m, and
15 m radius
R
.
R
= 8 m
R
= 9.8 m
R
= 15 m*
ME (%) r ME (%) r ME (%) r
ForeStereo sample
without correction
–35 0.78 –42 0.67 –66 0.48
Relaskop sampling +
Poisson attenuation model
–28 0.79 –36 0.68 –61 0.51
Distance-sampling
(Hazard-Rate)
29 0.78 57 0.66 92 0.47
Distance-sampling
(Hazard-Rate + covariate)
4 0.82 13 0.71 5 0.59
Distance-sampling
(Half-Normal + covariate)
16 0.82 36 0.71 35 0.59
HPC
–8 0.83 –11 0.78 –35 0.60
ates with 15 m maximum distance are compared
alculated with the 9.8 m radius field plot.
Figure 10.
DBH
distribution from ForeStereo up to a maximum sampling distance of 8 m (A), 9.8 m (B), and 15 m (C) vs
DBH
distribution measured in the field.
PHOTOGRAMMETRIC ENGINEERING & REMOTE SENSING
July 2019
503


