attenuation model for correction of occlusions reduced the
estimation bias slightly, to between 35%–69%. Among the
distance-sampling options the Hazard-Rate function per-
formed better than the Half-Normal function in terms of bias,
although the latter showed higher values of correlation with
field data. Although the distance-sampling method tends
to overestimate
N
, this overestimation is more notable with
the Half-Normal function. The Half-Normal model does not
accurately fit the distribution of distances: the
r
*g(
r
,
θ
) func-
tion should be proportional to the frequency histogram by
distance bins, however, the curve (scaled to make the integral
of the curve between 0 and R equal to the number of detected
trees) is over the detected frequencies at short as well as large
distances and below the detected frequencies for intermediate
distances (Figure 8). As most detected trees are located at in-
termediate distances (3–5 m), the underestimation of the sam-
pling probability for these distances results in an overestima-
tion of
N
.
HPC
estimates had the lowest bias for 8 m and 9.8 m
sampling distances (-6% and -10%, respectively), but tended
to underestimate
N
when the distance sampled increased to
15 m (bias of -33%). To help disentangle the effect of instru-
ment bias and occlusion effect corrections, Figure 9 compares
the distribution of sampling areas of all detected trees in the
15 m plots in the cases of instrument bias correction alone
and instrument bias combined with the occlusion corrections
for the Relaskop-based sampling with Poisson attenuation
model and for the
HPC
. The first method bases the instrument
bias correction on
DBH
, whereas
HPC
employs the diameters
detected during image segmentation, which are usually over
1.30 m height and are smaller than the
DBH
, resulting in a
greater reduction in sampling area for most trees (Figure 9).
Moreover, the Poisson attenuation model mainly depends on
plot density, providing a similar reduction in sampling area
for all trees in the plot, whereas the occlusion correction pro-
posed by
HPC
varies for each tree depending on the size and
position of all other trees within the plot.
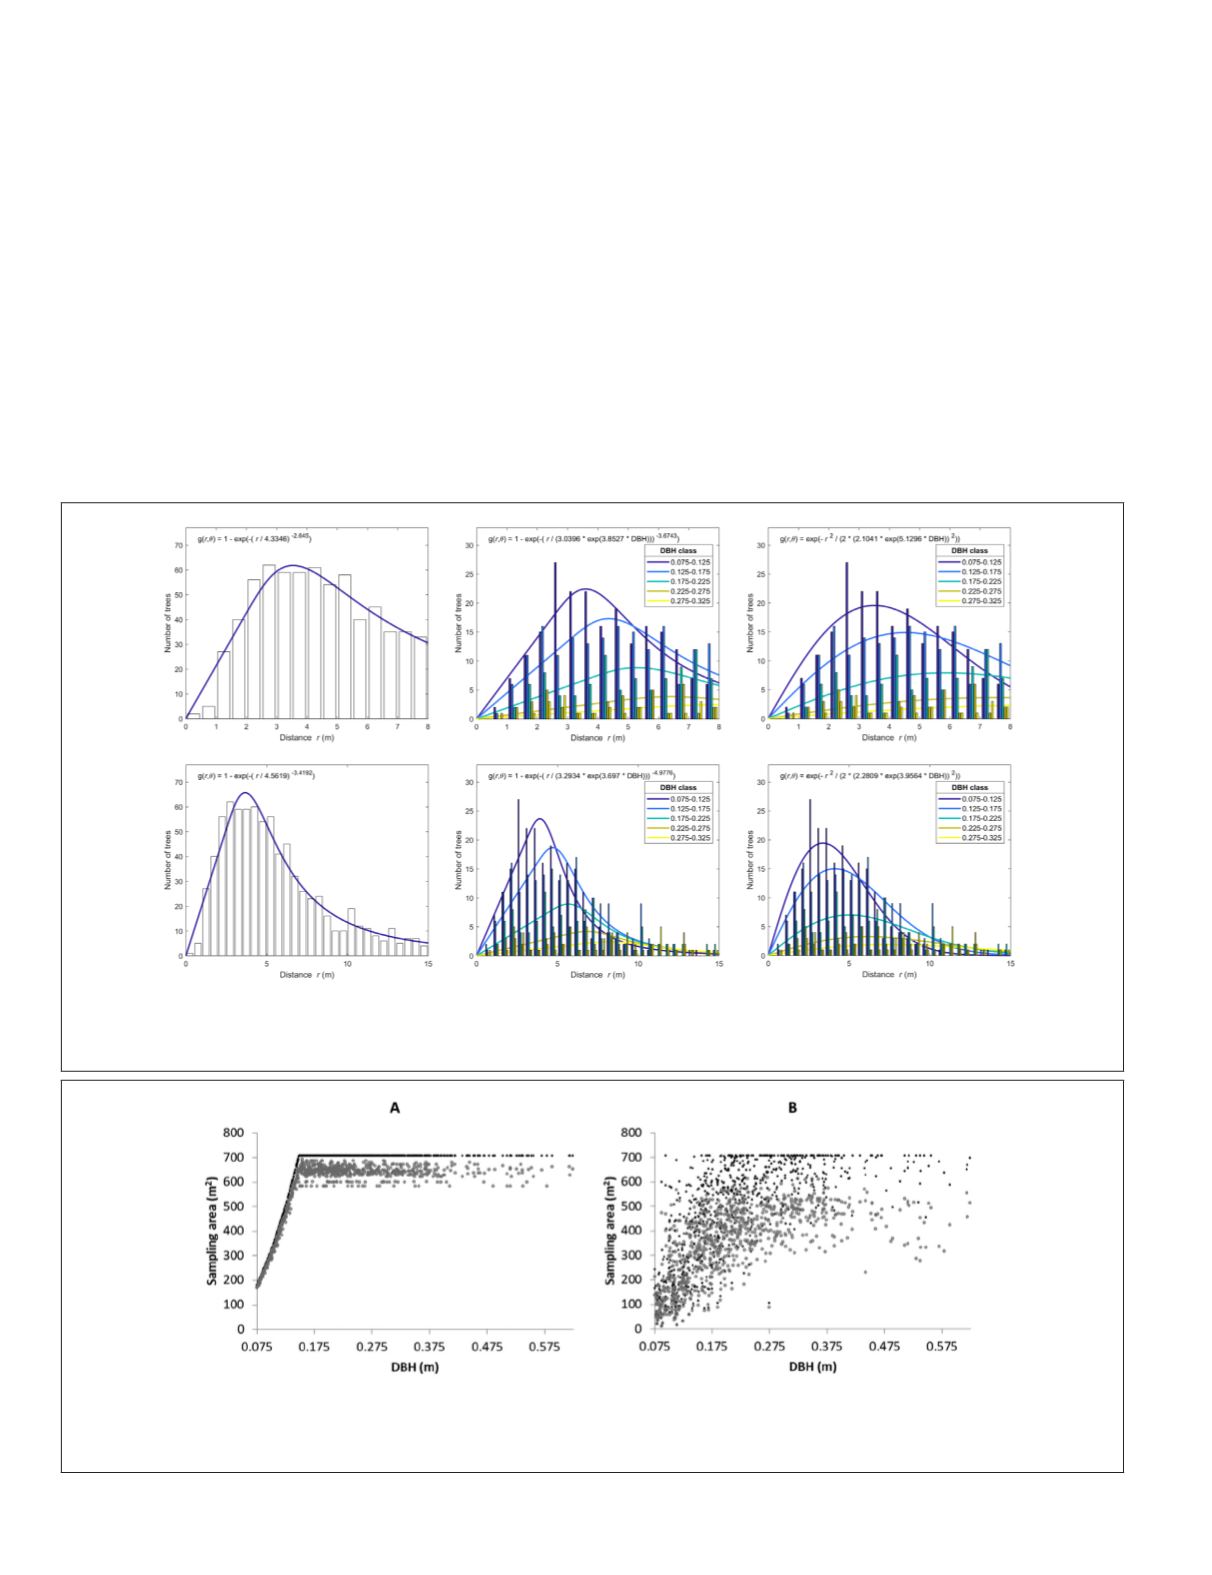
Figure 8. Number of trees by distance bins detected by ForeStereo compared with the scaled
r
*g(
r
,
θ
) of distance-sampling
with Hazard-Rate function (left), Hazard-Rate function with
DBH
as covariate (middle), and Half-Normal function with
DBH
as
covariate (right) for distance of truncation 8 m (above) and 15 m (below).
Figure 9. Estimated sampling areas corresponding to all detected trees in the 15 m radius plots when applying instrument
bias correction (black filled dots) and instrument bias and occlusion corrections (grey empty dots) for Relaskop-based
sampling and Poisson attenuation model (A) and hemispherical photogrammetric correction (B).
502
July 2019
PHOTOGRAMMETRIC ENGINEERING & REMOTE SENSING


