model). As Figure 9 shows, the image-based model can clearly
compensate for the empty regions of the
SLAM
model, and the
model coverage rate increases by approximately 56%.
Moreover, with the additional depth information to con-
strain the
SfM
process, the quality of the image-based point
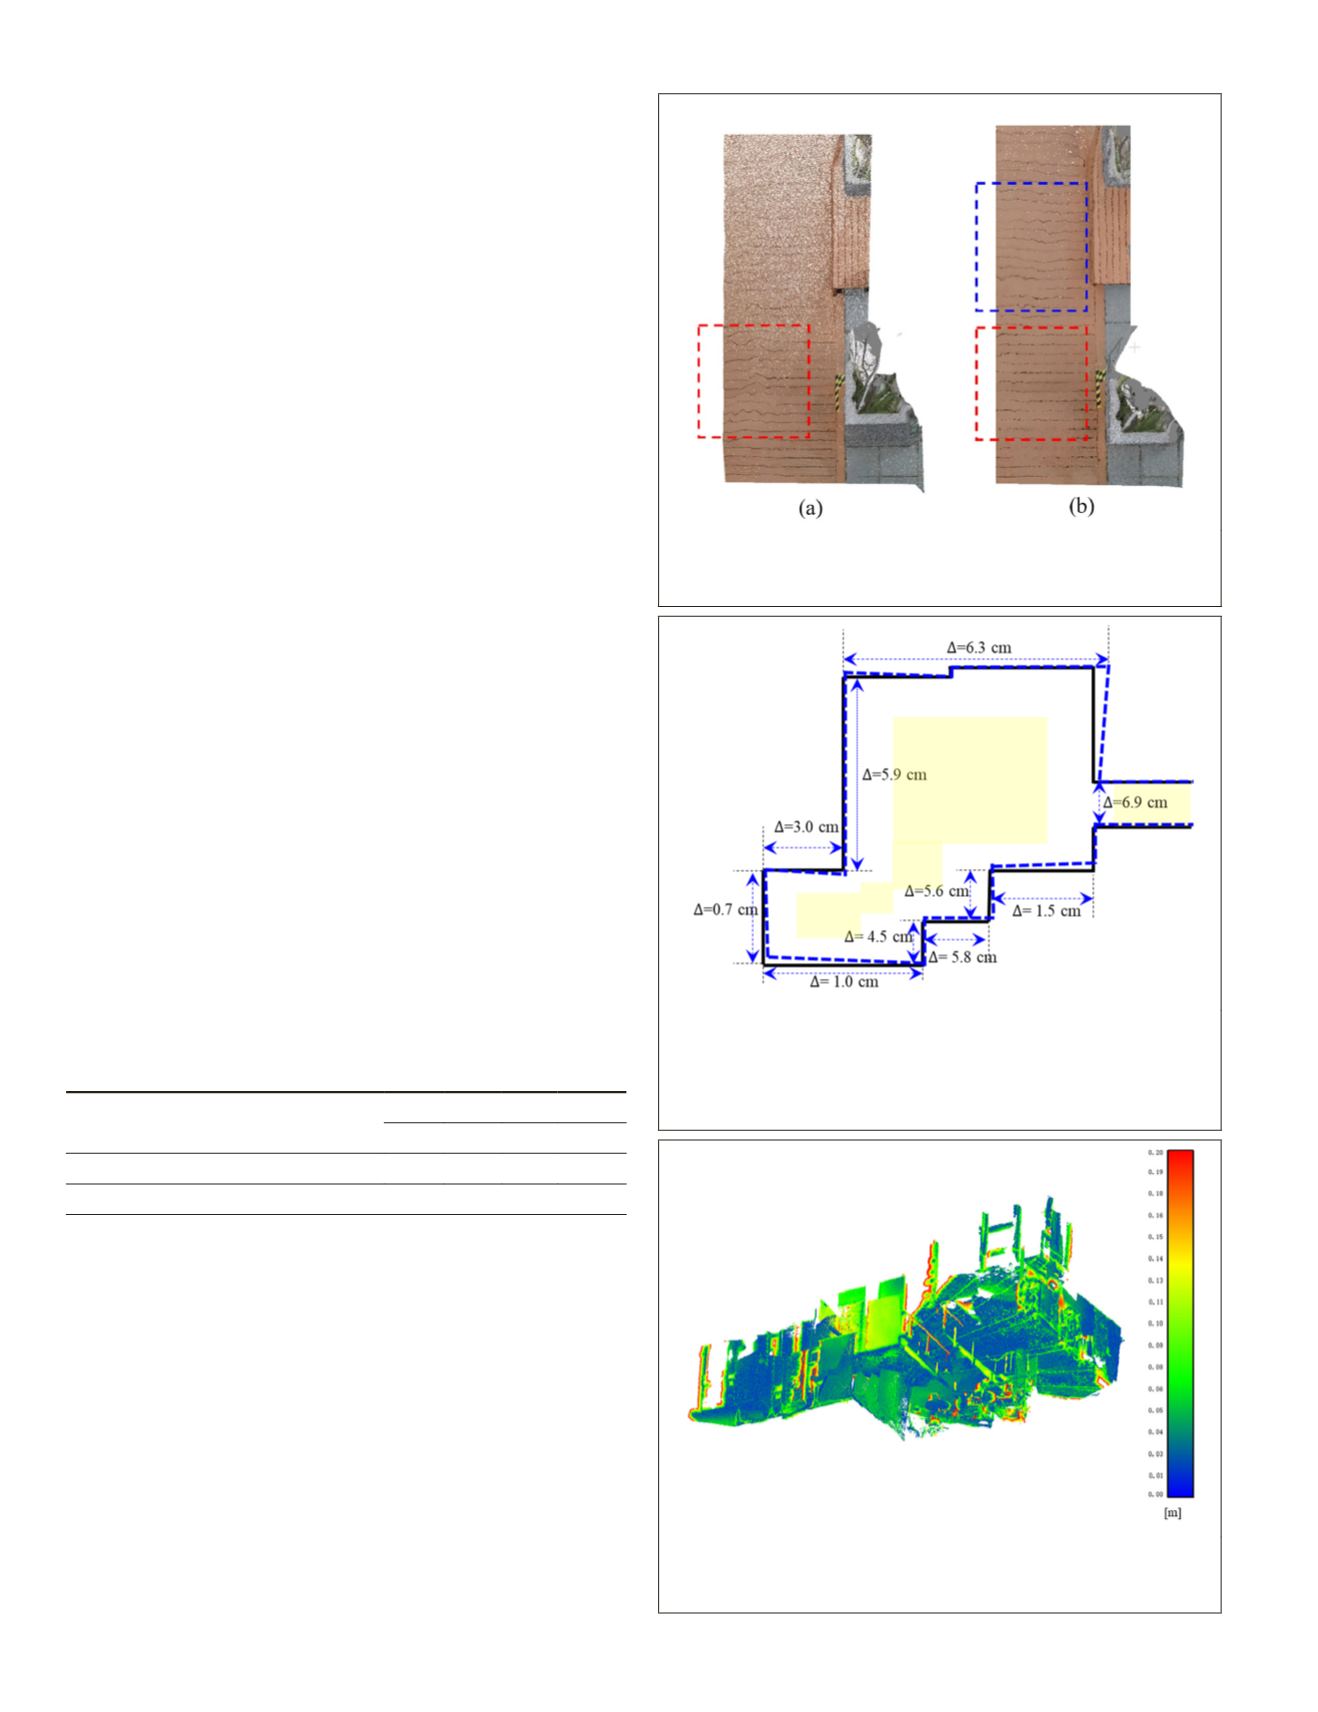
clouds is improved. Figure 10 shows the experimental results
of the obtained point clouds from the
SfM
+
MVS
with/without
the additional depth information. Comparing the point clouds
in the two red squares it can be seen that the additional depth
information can improve the geometric structure of the
SfM
+
MVS
solution. Although the improvement in the distant ranges
(e.g., the blue square in Figure 10b) is not significant as that
in the short ranges since the depth information from the
IR
camera is limited, the global geometric structure in the
SfM
+
MVS
solution benefits from the additional constraints.
Furthermore, favors from the designed scale-adaptive
registration of the image-based point clouds can recover the
scale information and ensure the correct geometric structure.
Figure 11 displays the biases in the
tween the ground truth (black lines)
(i.e., the distances in Figure 8) and t
and extended 3D mapping results (
Figure 11 shows, the obtained 3D m
correct geometric structure at both short and long ranges.
The maximum difference is 6.9 cm at the whole loop closure
point. One explanation for this situation is that there are
insufficient feature points to support the
SLAM
to implement a
reliable loop closure optimization. Thus, more overlaps in the
trajectory and revisiting the starting location can benefit the
SLAM
solution. More information about the biases between the
3D mapping results and the geometric structural ground truth
are presented in Table 1 and in Figures 11 and 12. Consider-
ing the accuracy requirements for the terrestrial laser scanner
cases, 1 cm mapping accuracy is reasonable for the low-cost
sensor (Ge and Wunderlich 2015). Figure 12 shows the 3D
comparison in terms of cloud-to-cloud distances between the
gained 3D model and the corresponding benchmark model.
We can see that the gained 3D model has good quality, with
point bias < 10 cm in the major areas. The maximum point
bias is 0.2 m, mostly at boundary points (see Figure 12). Table
1 also displays the summary information of the 3D compari-
son, including the maximum bias, the minimum bias, the
average bias, and the root -mean -square error (
RMSE
).
Table 1. Assessment of the corridor dataset.
Metric
Bias (cm)
Max. Min. Ave. RMSE
Geometric accuracy of structural edges 6.9 0.7 4.1 2.2
Comparison of point clouds
19.3 0.0 8.4 11.2
Subway Station Site
The subway station case (Figure 7) shows a working area of
about 20 m × 40 m. We also introduced the laser range finder
and the Leica BLK 360 scanner to produce the geometric
structural ground truth and the point clouds ground truth to
assess the gained enhanced and extended 3D mapping results.
Figure 13 displays a footprint of this area with the geometric
structural ground truth information. The red curve represents
the trajectory of
SLAM
, and the yellow areas represent the re-
gions outside the depth sensor’s working range. The specially
designed trajectory for this case also contains some loops (see
Figure 13) for the same purposes as those in the first case.
Figure 14a shows the 3D point cloud from the
SLAM
process
and Figure 14b shows the image-based
SfM
model. Figure 14c
displays the enhanced and extended 3D point clouds from
the proposed approach. In the image-based model (i.e., Figure
oint clouds generated from
) without the additional depth
the additional depth information.
Figure 11. Biases of the enhanced 3D mapping results
compared with the geometric ground truth in terms of the
footprint. Black lines represent the ground truth, and blue
dashed lines express the corresponding ground truth from
the enhanced 3D mapping results.
Figure 12. 3D comparison in the corridor dataset between
the obtained 3D point clouds and the ground truth point
clouds collected with a Leica
BLK
360 scanner.
638
September 2019
PHOTOGRAMMETRIC ENGINEERING & REMOTE SENSING


