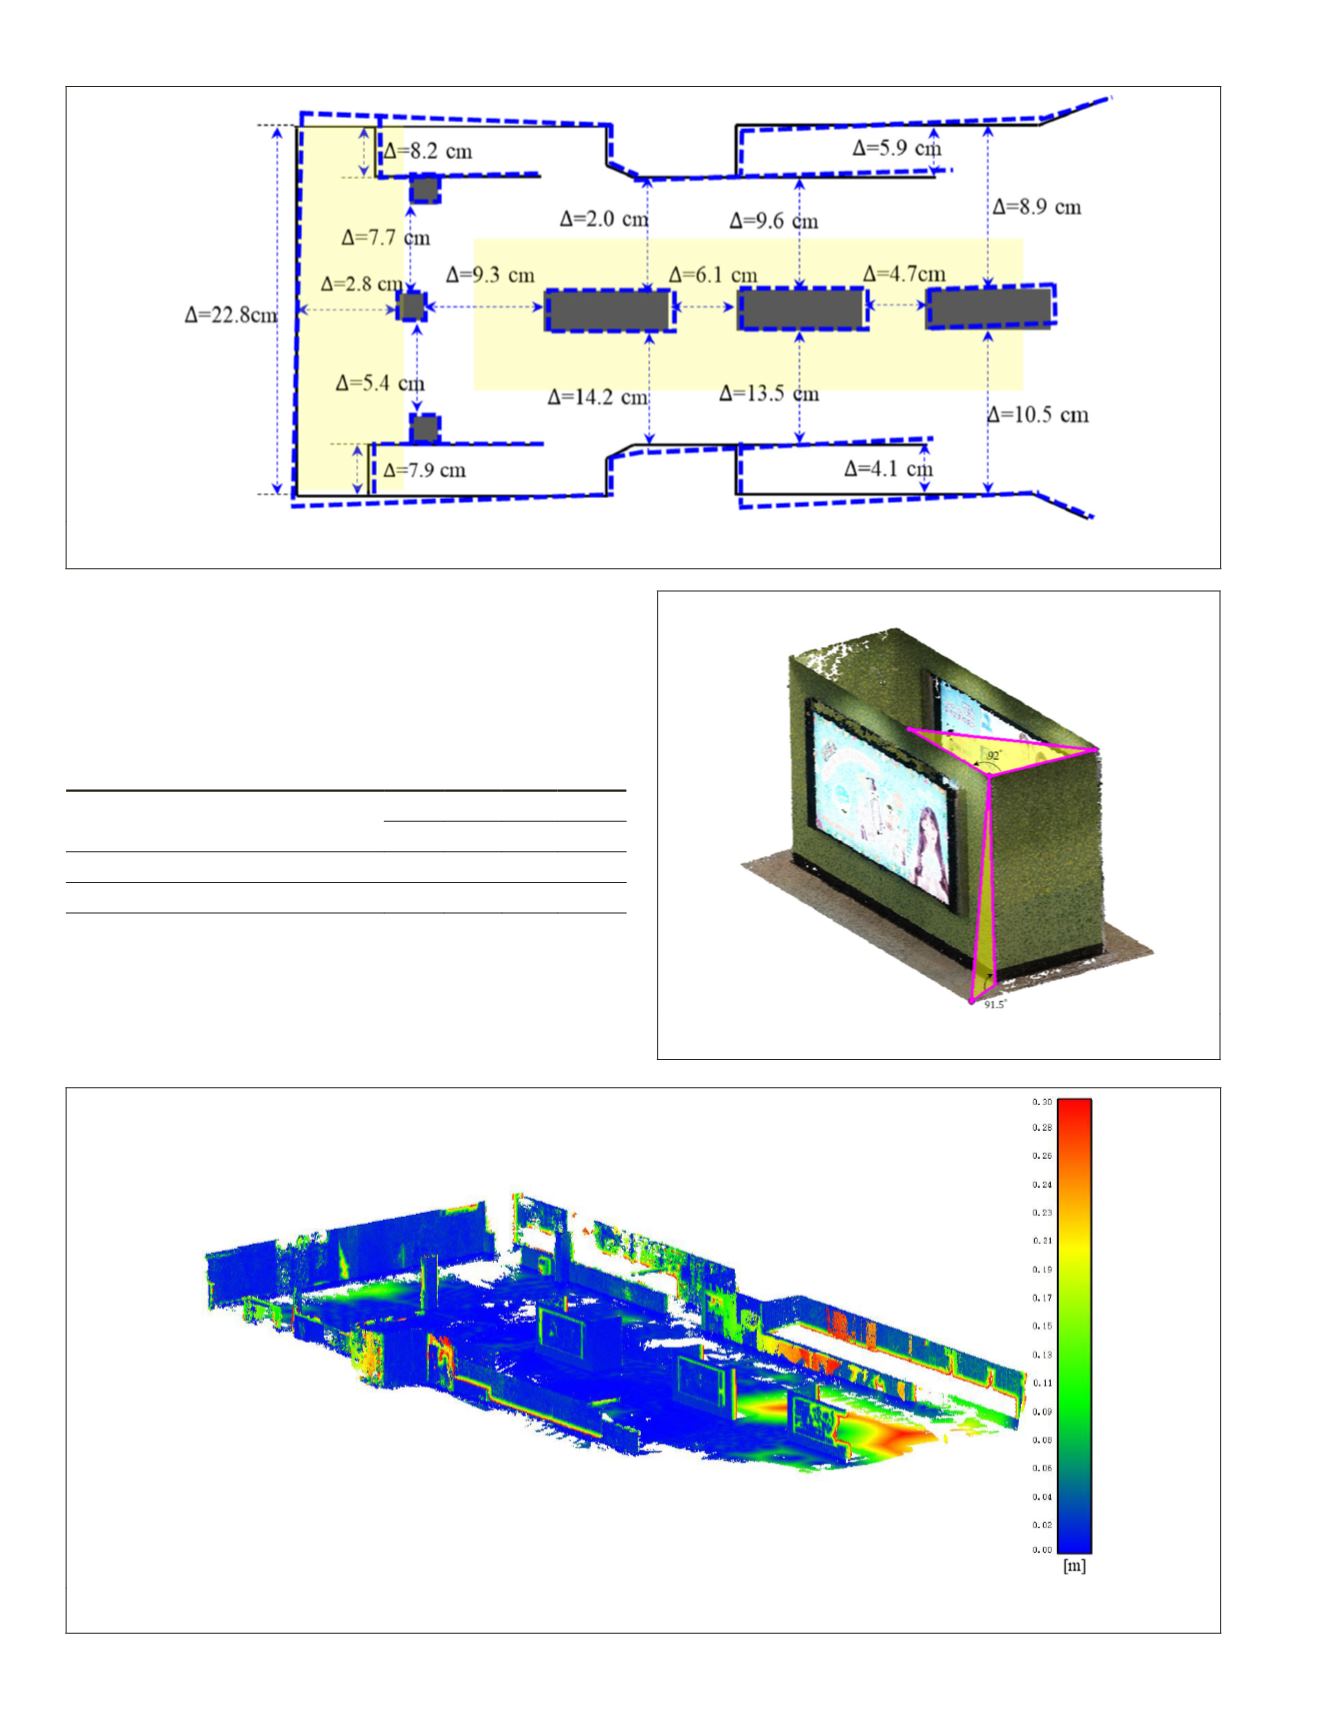
the major surfaces. The average bias of the 3D point clouds
is 9.3 cm (see Table 2). The poor results concentrated on the
right part of the ground points because in that location, the
terrestrial laser scanner was installed at ground level, so the
point density and the quality of the laser points on the ground
were poor because of the large incidence angles of the laser
ray (Ge 2016).
Table 2. Assessment of the subway station dataset.
Metric
Bias (cm)
Max. Min. Ave. RMSE
Geometric accuracy of structural edges 22.8 2.0 8.4 4.8
Comparison of point clouds
28.9 0.0 9.3 11.2
Conclusions and Discussion
In this paper, we presented a novel solution, integrating a
SLAM
point cloud model, and a
SfM
+
MVS
point cloud model
(i.e., image-based model) to generate enhanced and extended
3D mapping results using a low-cost
RGB-D
sensor. In the
Figure 17. 3D comparison of the subway station dataset between the obtained 3D point clouds and the ground truth point
clouds collected with a Leica
BLK
360 scanner.
Figure 15. Biases of the enhanced
truth in terms of the footprint.
Markings have the same meanings
Figure 16. Object’s details from the merged enhanced 3D
mapping results.
640
September 2019
PHOTOGRAMMETRIC ENGINEERING & REMOTE SENSING


