14b) the walls on the left and right were not detected by
SfM
because of the lack of texture information on those walls. It
is obvious that the image-based point cloud model can be
used to compensate the 3D
SLAM
point cloud model by the
proposed solution so as to obtain an enhanced and extended
3D mapping results. In this case, the growth rate of model
coverage is over 50%. Figure 15 shows the biases between the
geometric structural ground truth (black lines) and the cor-
responding enhanced 3D mapping (blue dashed lines) results.
The maximum bias increases to 22.8 cm at the longest tested
distance (about 20 m) (see Figure 15 and Table 2). In this case,
the accuracy of the gained enhanced 3D mapping results is
lower than that in the first case (see Tables 1 and 2 and Fig-
ures 12 and 17). One interpretation is that the scanning scope
of this area is much larger (about 800 m
2
) than the first case,
making it challenging for
RGB-D
SLAM
to maintain high accu-
racy. We show an object’s details from the enhanced 3D map-
ping results in Figure 16 to show that the proposed solution
has good performance in recovering the geometric structures.
We also assess the quality of the enhanced 3D point clouds by
implementing the 3D comparison with the benchmark point
clouds in terms of cloud-to-cloud distances (see Figure 17).
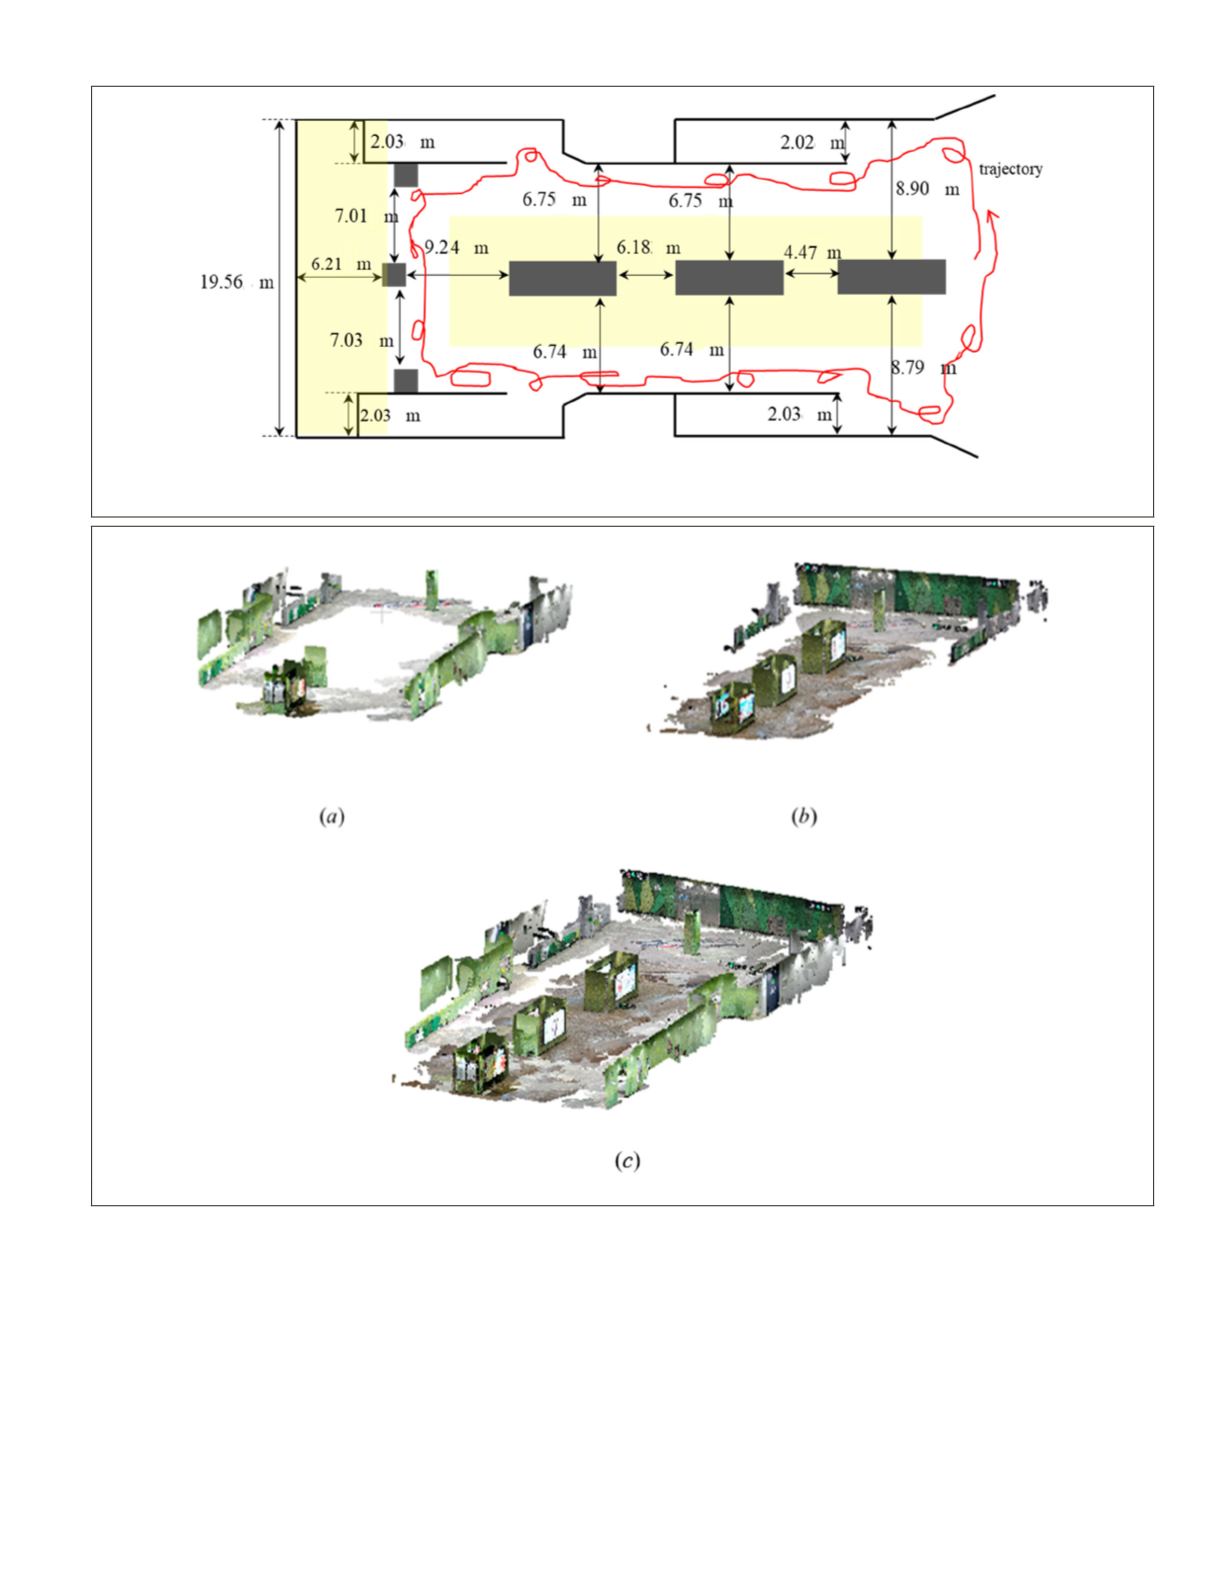
First, the geometric structure of the main body is correct. The
biases of the 3D point clouds are mostly less than 10 cm in
Figure 13. Floor plan of the subwa
the strategies of the designed
experiment.
Figure 14. The textured 3D point clouds generated by (a)
SLAM
, (b) image-based
SfM
, and (c) the proposed integrated approach.
PHOTOGRAMMETRIC ENGINEERING & REMOTE SENSING
September 2019
639


