To simplify the expression, we also
as urban and non–built-up area as non
Training Set for the FCN Model
The proposed
FCN
model needs block-level annotations for
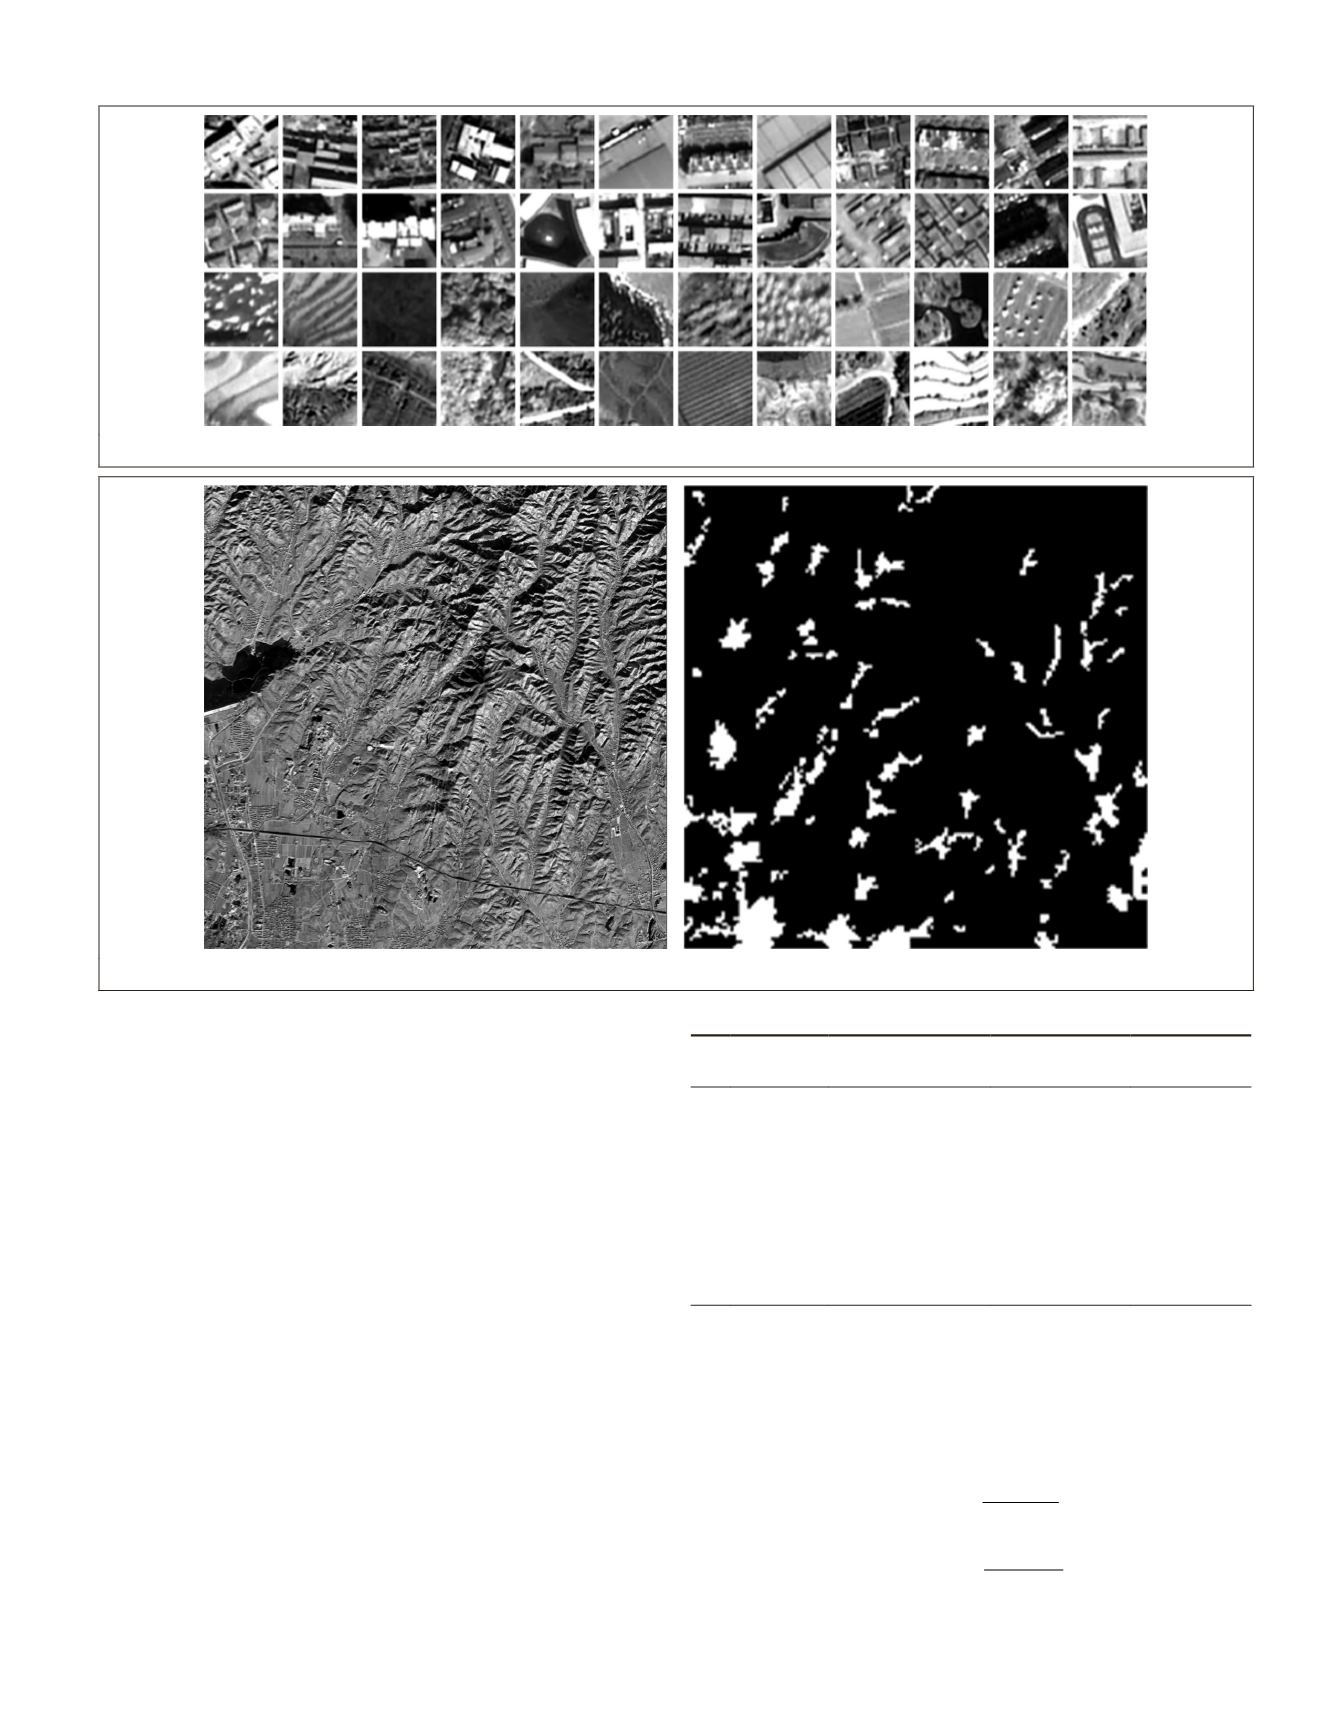
the training images, so we selected 56 panchromatic images
from the GaoFen-2 satellite. Each training image contains 10
240 × 10 240 pixels, and the block-level annotations have
been made manually. For a 64×64 image block, if the building
area ratio is greater than 50%, the image block is considered
to be a built-up area. The manual labeling results of these im-
age blocks are arranged in spatial position to obtain a 160×160
ground truth. One of the training images is shown in Figure 9.
Test Data for Comparison Experiments
To verify the performance of the algorithm, we built a full-
frame test data set. The data set contains 10 full-size images
that are located in five different provinces of China, including
Jiangsu, Yunnan, Hebei, Jiangxi, and Shandong. There is no
overlapping area among the test data set and the training data
of the deep models. Each panchromatic test image has a size
of 10 240×10 240 pixels, and the block-level ground truth of
built-up areas is manually labeled. In addition, we cut a por-
tion of each testing image that contains 2048×2048 pixels and
made a pixel-level annotate, considering that the compared
algorithms are too slow. Table 1 shows the basic information
for the test images.
Evaluation Indicators
The performance of the algorithms is verified by four evalua-
tion indexes, namely, User’s Accuracy (User.Acc), Producer’s
Accuracy (Prod.Acc), Overall Accuracy (Overall.Acc), and
mean intersection-over union (mean
IOU
). The formulas of
these indexes are as follows:
User.Acc
=
+
PT
PT PF
,
(7)
Prod.Acc =
PT
PT NF
+
,
(8)
Figure 8. Some labeled samples; the first two rows are samples of built-up areas, and the other rows are samples of non–built-up areas.
Figure 9. A training image of the
FCN
model; the left image is a panchromatic image, and the right image is a block-level annotation.
formation of the image.
itude
Latitude
Ratio of
Urban (10 240)
Ratio of
Urban (2048)
1 Jiangsu E119.36°, N31.34
°
0.091
0.059
2 Jiangsu E119.39
°
, N31.31
°
0.086
0.055
3 Yunnan E103.57
°
, N25.03
°
0.032
0.104
4 Yunnan E103.49
°
, N24.94
°
0.090
0.161
5 Hebei
E115.22
°
, N38.51
°
0.185
0.424
6 Hebei
E115.35
°
, N38.80
°
0.107
0.152
7 Jiangxi
E116.53
°
, N28.30
°
0.212
0.057
8 Jiangxi
E116.47
°
, N28.41
°
0.047
0.038
9 Shandong E117.31
°
, N36.25
°
0.172
0.164
10 Shandong E117.29
°
, N36.16
°
0.113
0.128
PHOTOGRAMMETRIC ENGINEERING & REMOTE SENSING
October 2019
743


