Correct match rate (
CMR
) is calcu-
lated as
CMR
=
CM
/
C
, where
CM
is the
number of correctly matched point
pairs, and
C
is the total number of
match point pairs. For each image
pair, 30 evenly distributed check
points are first manually selected
across the two images. Then, the
residual error of the matched point
pairs is computed using a geometric
transformation model. The point
pair is considered the correct match
to determine the
CM
, only when the
residual error of the point pair is less
than 1.3 pixels. Moreover, the
RMSE
(threshold is 1 pixel) of the correct
matched tie points is used to assess
the registration accuracy. After the
mismatched points are removed,
the tie points between the multi-
source remote sensing images are
extracted (see Figure 10). Finally, the
multisource registration is achieved
through the
PL
transformation model
(see Figure 11).
Experimental Analysis
Accuracy Analysis
The match accuracy of the proposed
method is assessed by two methods.
One method is a visual judgment to
verify the splice of the matched and
reference images. Another method is
to calculate the
RMSEs
of check points
between the two images.
The registration results of the five
test sets are shown in Figure 11, and
the subimages contain different ter-
rain structures, including lake banks,
roads, and rivers. As shown in the
subimages, the matched image coincides with the reference
image well regardless of the nonlinear
The slight deviations at the road splice
in Figure 11b) are still visible because
ment. The high-resolution image match
dled fundamentally by an image-to-image matching method
only when a true orthostatic rectification is applied.
Meanwhile, a set of 30 manually selected check points is
used to compute the
RMSEs
of the five tests. The performance
of image registration, as indicated by the
RMSEs
, is shown in
Figure 12 and Table 2.
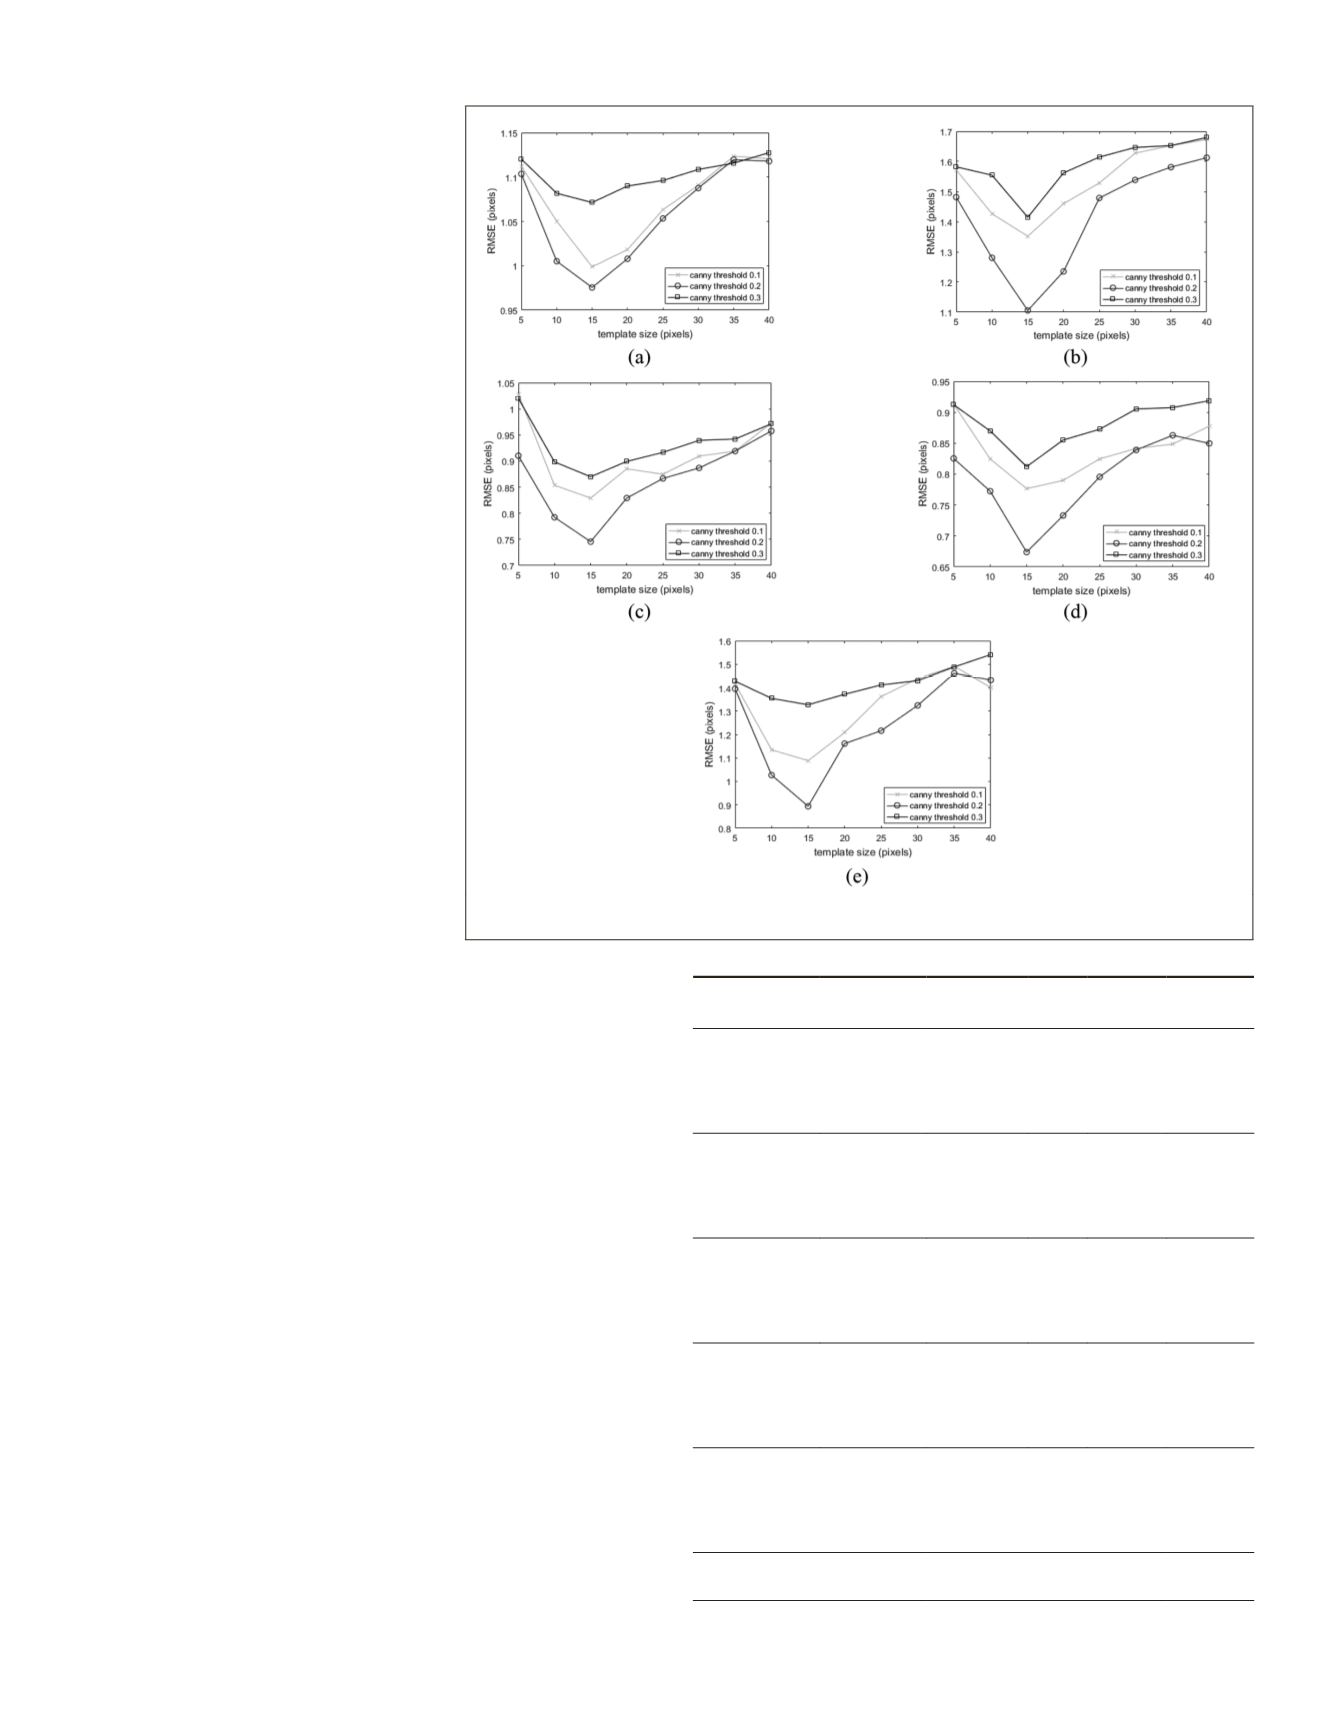
As presented in the section “Parameter Settings”, different
parameters are set to analyze the sensitivities of
SSSF
ncc
concern-
ing the changes of the template window size and canny thresh-
old. Figure 12 shows the
RMSEs
of each test of correct matched
point pairs. As the size of the template window increases, the
RMSEs
of these tests initially rises then falls. The image match-
ing accuracy of each test is the highest when the template win-
dow size is 15×15 pixels. Moreover, when the canny threshold
is set to 0.2, the proposed method obtains an improved match-
ing outcome. The reasons for these results are as follows:
For the template window size, any terrain feature in a
small region cannot be extracted. Additionally, the time and
geometric differences, local distortion, and the increase/
decrease and deformation of terrains across a large region
vary considerably, thus resulting in the drop of scene shape
similarity. Comparison shows that the terrain shape structures
of appropriate regions are quite similar.
Figure 12.
RMSEs
of all test sets: (a) optical-
SAR
1, (b) optical-
SAR
2, (c) optical-
SAR
3,
(d) optical-
SAR
4, (e) map set.
Table 2. Matching performance of all methods.
ods
Matched
Points
CMR
(%)
RMSE
(Pixel)
Time
(Seconds)
sed 253/286 88 0.97 93.1
79/233
33 1.5
28.3
HOPC
ncc
158/184 86 0.976 107.9
CSLTP
208/247 84 0.99 88.4
Optical-
SAR
2
Proposed 442/491 90 1.11 87.5
NCC
161/436 37 1.6
24.1
HOPC
ncc
186/214 87 1.192 94.9
CSLTP
381/448 85 1.3
81.7
Optical-
SAR
3
Proposed 222/244 91 0.74 35.6
NCC
67/193
35 1.4
16.7
HOPC
ncc
127/141 90 0.809 39.4
CSLTP
195/224 87 0.93 33.5
Optical-
SAR
4
Proposed 327/352 93 0.67 36.1
NCC
114/301 38 1.3
14.6
HOPC
ncc
163/171 95 0.806 36.9
CSLTP
291/323 89 0.72 34.8
Image-map
Proposed 77/85
90 0.89 25.1
NCC
18/63
28 1.4
12.2
HOPC
ncc
65/82
79 0.912 28.9
CSLTP
62/76
81 0.97 23.3
Matched points: correct match points/total match points.
CMR
: correct match rate.
PHOTOGRAMMETRIC ENGINEERING & REMOTE SENSING
October 2019
733


