any refinement. In addition, we zoom out the width and
height of the test images from 16 384 to 6400 pixels consider-
ing that the resolution of the WorldView-3 image is 0.3 m and
that the multi-channel images are transformed to gray images.
The basic information of the test images is shown in Table 9.
We have shown the results in Figure 14. As we can see, the
image of Kalgoorlie is located in the suburbs that have little
built-up area, the image of São Paulo and New Delhi is locat-
ed in the urban center, and the image of Madrid is located on
the urban fringe. The results of the first three rows show that
our deep models can be effectively extended to WorldView-3
images without retraining. Our network was trained with the
samples extracted from the image captured in China. There
were no such built-up area training samples that have too
much open space without buildings or that are covered by a
large amount of vegetation. For example, in the image of New
Delhi, many of the built-up areas in the white circle are not
detected. New Delhi has high vegetation coverage and sparse
building distribution, which are not included in the training
samples. This is the main reason that it performs poorly in
the fourth row without retraining the network.
Conclusion
We provide a strategy for extracting the built-up areas from
large remote sensing images, and its excellent performance
has been verified by extensive experiments. The core idea of
the proposed algorithm is to apply the
FCN
model, which is
very good at semantic segmentation. We adopt the
LMB-CNN
to extract deep features of image blocks that are divided by
checkerboard partitioning and then rearrange the features into
multi-channel feature maps. We segment the feature maps by
an
FCN
model and obtain the final result via voting, which can
balance the false alarm and missing alarm. We obtain 98.75%
of block-level Overall.Acc on the test data set, in which each
image has 10 240×10 240 pixels. At the pixel level, the pro-
posed algorithm obtains 96.9% of Overall.Acc and 88.58% of
mean
IOU
. Experiments demonstrated that our algorithm per-
forms stably in all test images and is superior compared to the
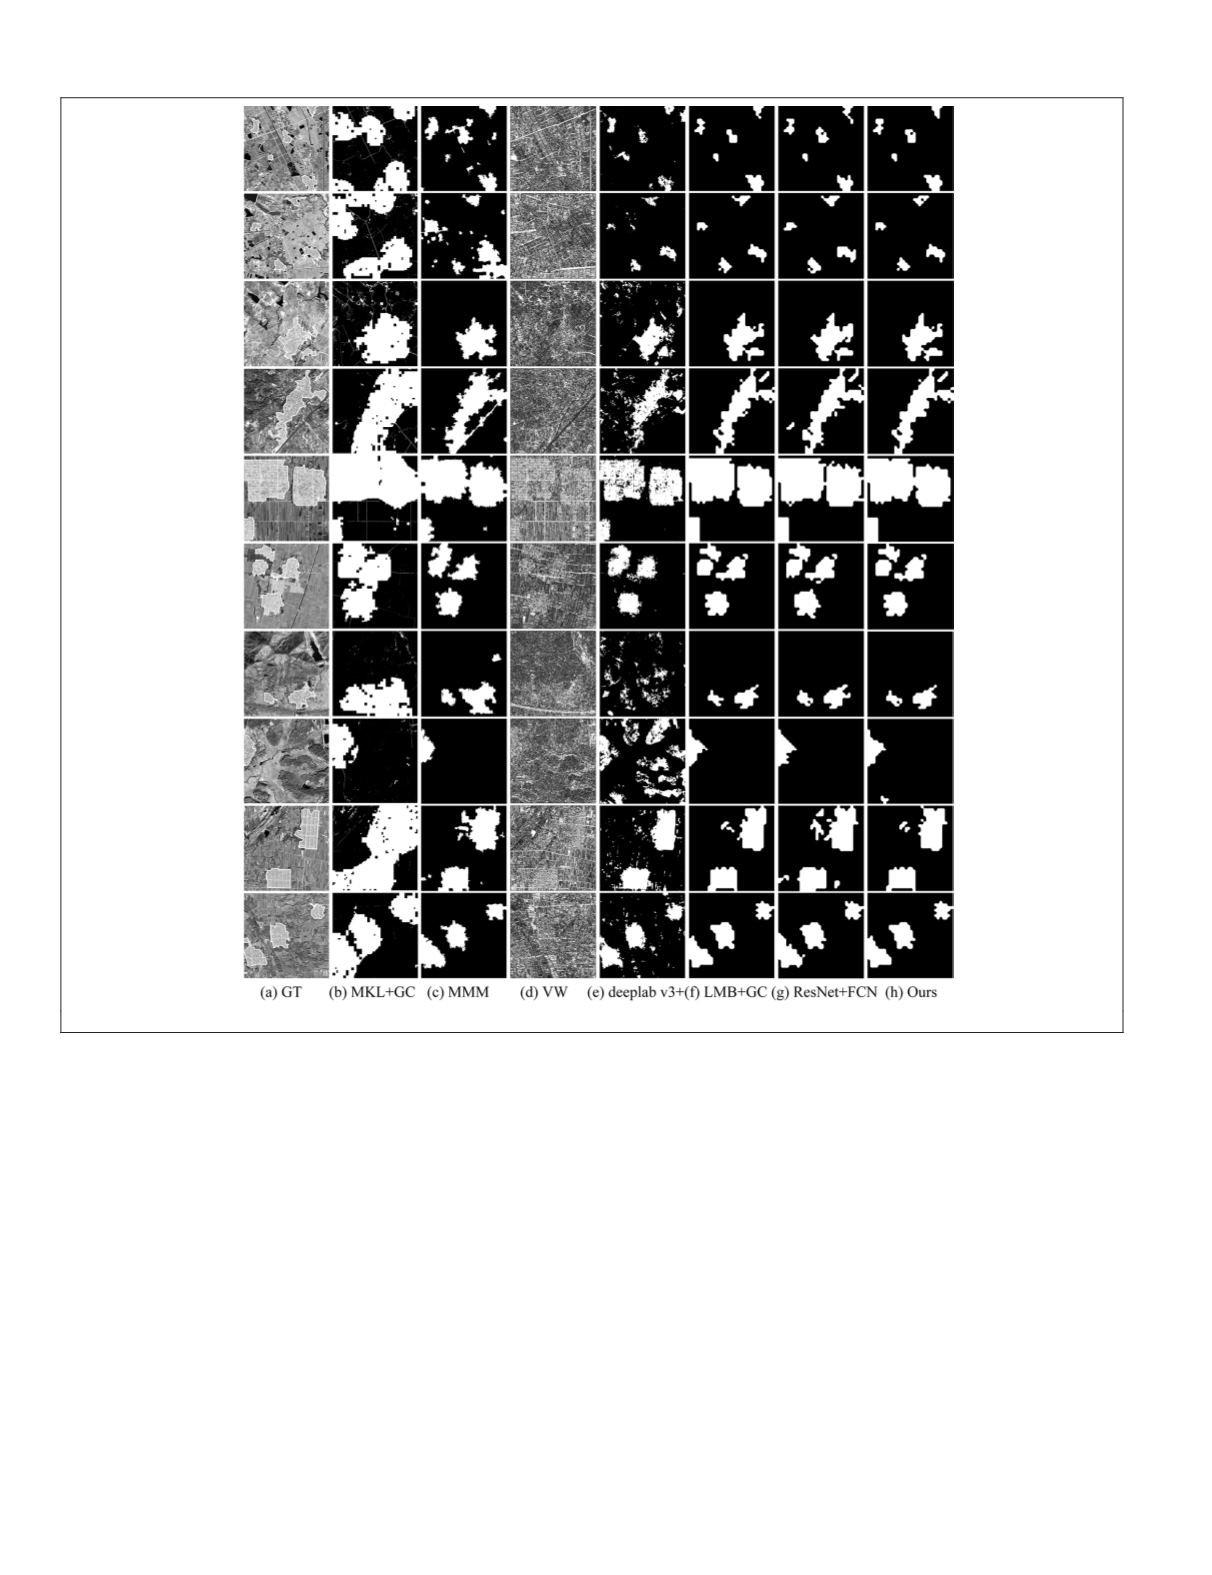
Figure 13. Results of comparing supervised algorithms and ours, each row corresponding to a 2048×2048 pixel test image.
748
October 2019
PHOTOGRAMMETRIC ENGINEERING & REMOTE SENSING


