The second data set is located in Lower Gwydir Catch-
ment (LGC), northern part of New South Wales (149.2815°E,
29.0855°S), with 14 cloud-free Landsat-
MODIS
image pairs, of
which Landsat images are all from Landsat-5. This area covers
5440 km
2
, including 3200 × 2720 pixels with the resolution
of 25 m. For the two data sets,
MODIS09GA
data is transformed
geometrically and sampled to 25 m resolution using the near-
est neighbor algorithm. And all the
MODIS09GA
data has been
coregistrated with Landsat data.
Quantitative Evaluation Indices
In order to quantitatively evaluate the effectiveness of the
fusion results, six evaluation indices were calculated to
compare the difference between the fused image and the real
image in different aspects. These indices are usually used to
evaluate the accuracy of fusion results in the field of image
fusion. The first indicator is root-mean-square error (
RMSE
),
which is often used to evaluate the difference between the
predicted and actual values. The second index is r, which
is a statistical index used to evaluate the linear relationship
between predicted and actual images. Erreur Relative Glo-
bale Adimensionnelle de Synthѐse (
ERGAS
) is a reliable global
index (Du
et al.
2007), which is used to evaluate the overall
fusion results. The closer the value of
ERGAS
is to zero, the
better the fusion result is.
ERGAS
RMSE
=
=
∑
100 1
1
2
R N
k k
k
k
N
( , )
( )
,
I J
I
µ
(9)
where
R
is the ratio between image
J
and
I
of the
k
th
band.
RMSE
(
I
k
,
J
k
) indicates the
RMSE
between them.
μ
(
I
k
) denotes the
mean value of them.
N
is the number of bands.
Structural Similarity Index Measurement (
SSIM
) is in-
troduced to measure the structural similarity between the
predicted image and the real image (Wang
et al.
2004). The
more similar the spatial structure between the fused image
and the real reference image, the closer the
SSIM
value is to 1.
It is formulated as
SSIM
( , )
(
)(
)
(
)(
I J
I J
I
J
I
=
+
+
+ +
2
2
1
2 2
1
2
µ µ
σ
µ µ
σ
C
C
C
where
μ
I
and
μ
J
represent the mean value of Image
I
and
J
, re-
spectively.
σ
I
and
σ
J
are the corresponding variances of them.
σ
I,J
is the covariance of them, and
C
1
and
C
2
are two small
constants to keep the formula stable when the molecule is ap-
proximately equal to zero.
The fifth index is Spectral Angle Mapping (
SAM
), which is
used to assess the degree of spectral distortion of the fusion
results (Dennison
et al.
2004). Smaller
SAM
means images
have better spectral fidelity. It can be represented as
SAM
( ,
) arccos
,
.
{ } { }
{ } { }
{ } { }
I J
I J
I J
i
i
i
i
i
i
=
(11)
The last measure is Universal Image Quality Index (
UIQI
)
(Wang and Bovik 2002). The closer the fused image is to the
original image, the closer the
UIQI
value is to 1.
UIQI
IJ
I
J
IJ
J
= ⋅
( )
+
( )
⋅
+
σ
σ σ
σ σ
σ σ
I
I J
I
J
2
2
2 2 2 2
,
(12)
where I– and J– denote the mean values of the actual image I
and fused image J, respectively.
σ
I
and
σ
J
denote the variances
of them, and
σ
IJ
is the covariance between them.
Experiment 1
In the training stage, the 1st, 2nd, 5th, 6th, 9th, 10th, 13th,
and 14th images in the
CIA
data sets are set as training data,
the 1st, 5th, 9th, and 13th images are selected as input data
to predict the other four adjacent images. In the testing stage,
a total of eight pairs of data are used for testing, eight images
consisting of the remaining 2nd, 3rd, 6th, 7th, 10th, 11th,
15th, and 16th are used as input data to predict the other
eight adjacent images that are behind them in the data set.
The number of loops is set to 300, the input image is cropped
to 32 × 32, and the step size is set to 16. A total of 12 896
subimage blocks are segmented as training data sets for train-
ing. During the prediction period, the entire image can be
input directly into the trained network to obtain the output.
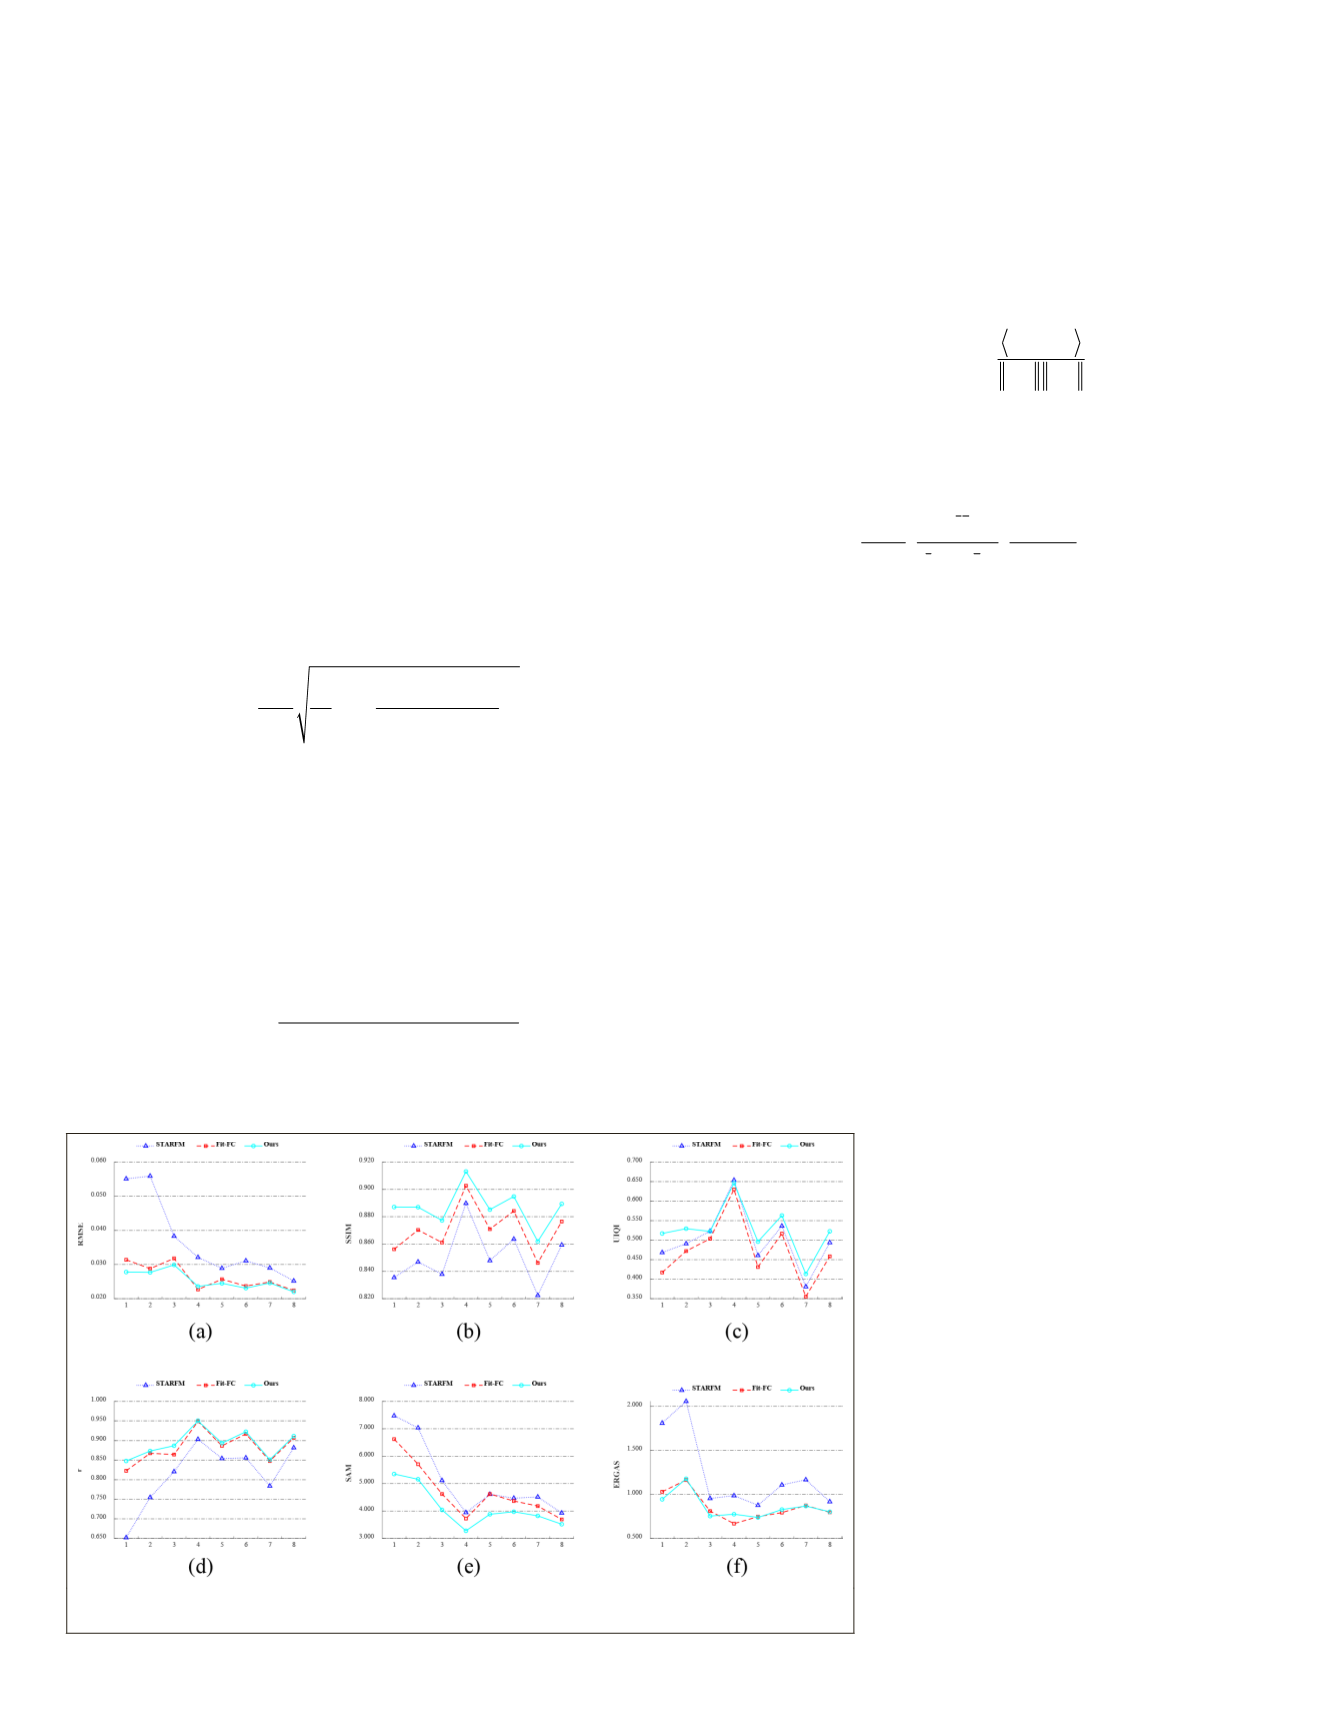
aluation results of eight image pairs in
n in Figure 3. As can be seen from the
proposed algorithm has the smallest
SAM
SIM
,
UIQI
and r values, which indicates
that the proposed method can predict spectral information
and spatial structure with higher
fidelity. Compared with
STARFM
and
Fit-FC
, the smaller
RMSE
and
ERGAS
also
show that the proposed algorithm has
better robustness.
In order to show more details of
the fusion results, the fusion results
of 10 March 2002 are selected for
further analysis. The Landsat-
MODIS
images on 22 February 2002 and
the
MODIS
image on 10 March 2002
are used as input data to predict the
Landsat image on 10 March 2002.
These data are shown in Figure 4.
The fusion results of the three
algorithms are shown in Figure 5.
Generally speaking, three algorithms
all can capture seasonal changes to a
certain extent. However, from their
corresponding enlarged regions in
Figure 5, it can be found that the fu-
sion results of
STARFM
and
Fit-FC
show
Figure 3. Quantitative assessment results for Experiment 1. (a)
RMSE
, (b)
SSIM
, (c)
UIQI
, (d) r, (e)
SAM
, (f)
ERGAS
.
910
December 2019
PHOTOGRAMMETRIC ENGINEERING & REMOTE SENSING


