to map and monitor intertidal
L. conchilega
aggregations, and
(2) develop a protocol for remote identification of reef-like
tube aggregations.
Methods
Study Area
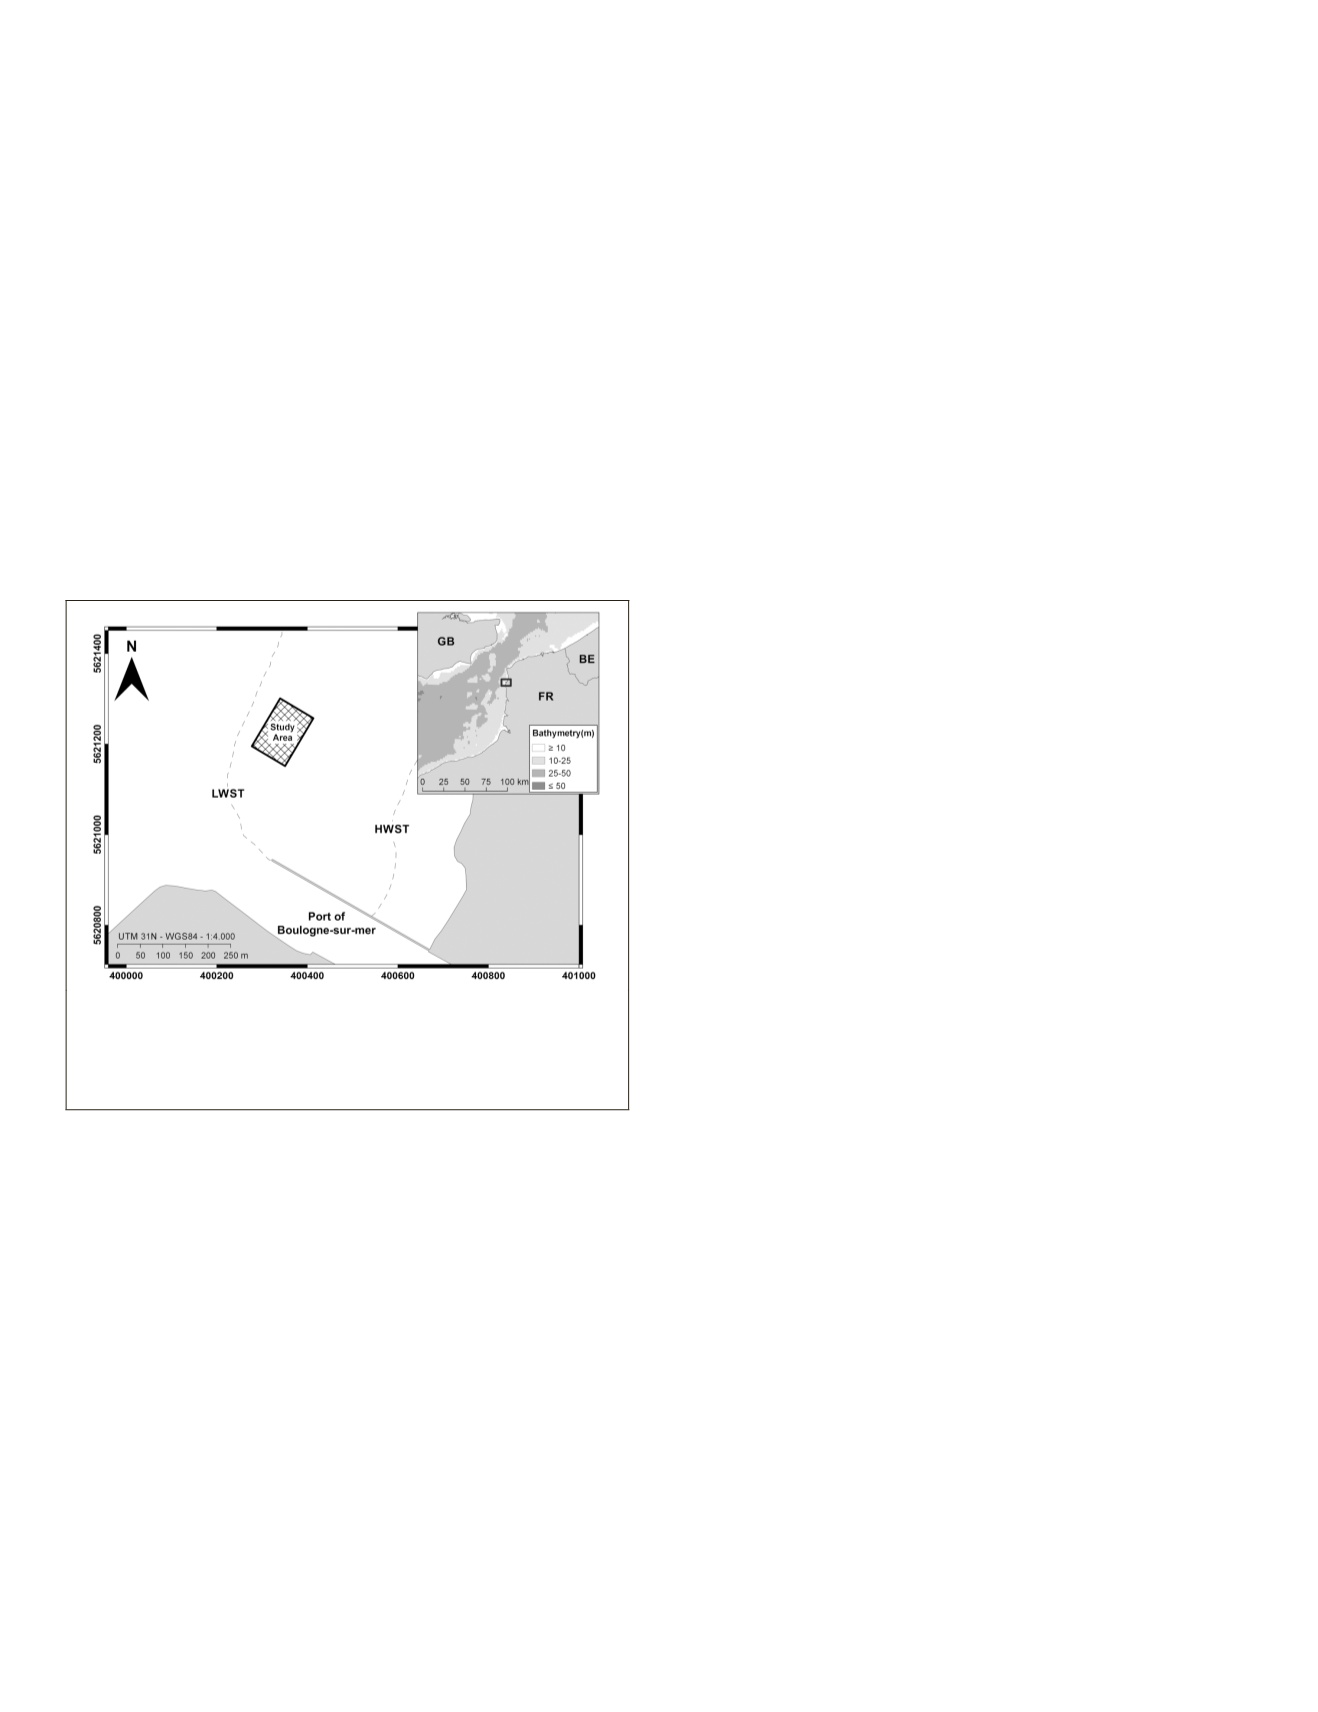
The study site was located at the sandy beach in Boulogne-
sur-Mer (Nord-Pas-de-Calais, France), north of the harbor
wall by 250 m (centroid: 400309.649152E, 5621211.02256N,
Universal Transverse Mercator 31N), and covered an area
of approximately 3700 m
2
(Figure 1). This area was selected
due to the presence of well-developed
L. conchilega
aggrega-
tions and accessibility during low water spring tide (
LWST
)
for acquisition and sampling. The beach is subjected to a
semidiurnal tidal regime, with sea level ranging from 4 to
9 m (Jouanneau, Sentchev, and Dumas 2013), and exposure
time of approximately 4 h during
LWST
(determined from tidal
gauge data) (Service Hydrographique et Océanographique de
la Marine 2015) (
SHOM
). The sediment is predominantly com-
posed by fine and medium sand (Rabaut
et al.
2008).
Figure 1. Map of the sandy beach in Bo
monitored area in the study site (hashe
of Boulogne-sur-Mer to the south, and t
and high water spring tides (
LWST
and
approximated using satellite imagery.
In Situ
Surveys
Intertidal
L. conchilega
aggregations in the study site were
mapped on a monthly basis during
LWST
from June 2013 until
November 2014 and again in April and August 2015, total-
ling 20 campaigns. Image acquisition was performed using a
compact digital camera attached to a FlowForm kite through
a mechanical picavet suspension. The camera was flown
between 7 m and 20 m above ground level, acquiring images
with a 3 seconds interval as the kite pilot walked the study
site. Aerial photographs were taken using a Canon PowerShot
D20 (lens: 28–140 mm, sensor size: 6.2 mm × 4.6 mm, pixel
size: 1.54 µm, effective pixels: 4000 × 3000).
The Canon Hack Development Kit (
CHDK
2013) was used
for image acquisition with controlled parameters: an exposure
value of 1/500 seconds, focal length of 28 mm, and a fixed In-
ternational Organization of Standardization (
ISO
) determined by
light conditions at the beginning of each campaign as either 100
or 200
ISO
. These settings result in a theoretical ground sam-
pling distance of 1 mm and less. Georeferencing was performed
using two techniques according to equipment availability: a
differential system based on real-time kinematic (
RTK
) satellite
navigation connected to global navigation satellite systems
(
GNSS
) was deployed in four campaigns using two Trimble R6
receivers (i.e., April 2014, October 2014, April 2015, and Au-
gust 2015); whereas a handheld Garmin
eTrex
10
GNSS
receiver
was employed for all other campaigns with an expected accu-
racy of approximately 3.5 m–5 m (Garmin Ltd. 2011).
Image Processing and Aggregation Detection
A virtual three-dimensional (3D) reconstruction of the to-
pography was built from the sampled aerial photographs per
campaign using low-altitude digital photogrammetry tools in
Agisoft PhotoScan v1.2.3 (Agisoft
LLC
2016). Image alignment
and 3D pixel ray projection was performed using structure
from motion and multiview stereo algorithms, resulting in
one dense point cloud per campaign (Verhoeven 2011). Point
clouds were triangulated in 2.5 D, resulting in
DEMs
of the
study site (Verhoeven 2011). The reconstruction was ex-
ecuted per campaign to create one
DEM
per month from which
equidistant digital terrain models (
DTMs
) and rectified image
mosaics (orthophoto mosaics) were extracted with an aimed
resolution of 1 cm. Accuracy was assessed by estimating
the root-mean-square error (
RMSE
) (i.e., difference in meters
between Ground Control Points (
GCP
) predicted position and
real position), and precision (i.e., difference between
GCP
predicted dimensions and real dimensions) (sensu Bryson
et al.
2013). Subsequently, digital terrain models and ortho-
photo mosaics were used to apply guidelines developed by
(Rabaut, Vincx, and Degraer 2009) to evaluate
L. conchilega
aggregations. The success of digital photogrammetry and
KAP
in particular was assessed by evaluating the image acquisi-
tion process (i.e., mapping), the accuracy of photogrammetric
reconstruction, and the validity of local relief models (Smith,
Chandler, and Rose 2009).
The process to distinguish aggregations from bare sediment
involved remotely assessing features suggested by previous
studies—i.e., individual area/size, individual relative eleva-
tion, total extent, fragmentation, and longevity.
ArcGIS
Desktop
v10.3 (
ESRI
2014) was used to develop a semiautomated detec-
tion protocol consisting of four steps: (1) image classification,
(2) reduction of classification noise, (3) conversion of absolute
elevation to local differences, and (4) automated edge delin-
eation (
AED
). Maximum Likelihood Image Classification was
te pixels among four classes based on
L.
nd the expected ecosystem engineering
a
tubes on sediment composition (see
De Smet
et al.
2015; Rabaut
et al.
2007): (1)
Lanice conchilega
,
(2) muddy sediment, (3) dry sand, and (4) reworked sedi-
ment. Each class was visually characterized (Table 1) and the
semiautomatic maximum likelihood classification algorithm
(
MLC
) was executed using manually delineated training
samples (Otukei and Blaschke 2010). Classification accuracy
was assessed by verifying inter-rater agreement per campaign
through Cohen’s Kappa between automated and manual pixel
assignments, estimating true/false pixel assignments between
L. conchilega
presence and absence (n = 12).
Classification noise was reduced by removing features
smaller than 3 cm in length/diameter (Gonzales and Woods
2001) using successive applications of morphological erosion
and dilation of classification boundaries by 3 cm (Gonzales
and Woods 2001). Subsequently,
DTMs
were converted to local
relief models (
LRM
) using local detrending (Wilson and Gallant
2000). Mean elevation surfaces (
MES
) were produced per cam-
paign as estimates of global trends by averaging absolute el-
evation within moving windows of fixed size (Wilson and Gal-
lant 2000). Each
MES
was subtracted from its respective
DTM
resulting in surfaces of relative elevation per campaign (i.e.,
local relief models) (Wilson and Gallant 2000). Kernel size of
the
MES
obviously had an impact on the vertical resolution of
LRMs
(Wilson and Gallant 2000). Thus, we evaluated several
900
December 2019
PHOTOGRAMMETRIC ENGINEERING & REMOTE SENSING


