Noise reduction resulted in 13.7% (SD: 6.1%) of pixels in
the presence/absence rasters being reclassified. Reclassifica-
tion was highest for pixels initially assigned to the
L. conchi-
lega
class with 13.0% (SD: 6.1%) being reclassified as bare
sediment after noise reduction. Conversely, only 0.6% (SD:
0.6%) of bare sediment pixels were reclassified as
L. conchil-
ega
after noise reduction. The percentage of unchanged pixels
fluctuated around 86.3% (SD: 6.1%).
Concordance between
AED
and manually delineated
samples was low with Cohen’s kappa ranging from 0.04 to
0.63. The window sizes used to average elevation influenced
boundary delineation accuracy by impacting the final posi-
tion of automated edges on aggregations edge slope creating
spatial trends (e.g., Figure 3). Employing small windows (i.e.,
< 500 px/5 m) resulted in lower accuracy (i.e., higher false
absence) in areas with well-developed
L. conchilega
aggrega-
tions than larger windows (e.g., Figure 3b), and higher accu-
racy (i.e., lower false absence) for areas with small and sparse
aggregations (e.g., Figure 3c).
Discussion
Our study focused on (1) evaluating the use of kite aerial
photography and digital photogrammetry to map intertidal
L. conchilega
aggregations; and (2) developing a protocol for
remote detection of these intertidal aggregations.
Temporal Patterns in Population Density and Demographic Structure
Kite aerial photography was successfully used under a vast
variety of weather conditions (e.g., high humidity, variable
winds, salt exposure, and light rain) and thus fulfilled the en-
vironmental requirements for coastal deployment (Goodman
Purkis, and Phinn 2013) which are often suboptimal for pho-
togrammetric acquisition. Optimal wind speed was between
approximately 2 bft (enabling lift-off with rig and camera,
personal observation) and 5 bft (maximum recommended
for the kite by its manufacturer, Beeusaert-Braet 2010). Wind
turbulence during acquisition hindered photo selection and
matching during reconstruction, as it often resulted in blurred
photographs. Therefore,
KAP
should be deployed frequently
when performing environmental monitoring. Alternative
platforms such as unmanned aerial vehicles (
UAVs
) may be
Figure 2. (a) Training sample for the
Lanice conchilega
class
(hashed polygon in A) on the orthomosaic from April 2015.
(b) The lowest classification accuracy was observed during
this date, likely due to interspersion of sand pixels between
L. conchilega
pixels in the training samples causing overlap
between signatures. Histograms show count of pixels (vertical
axis) per value (horizontal axis) in each band of the orthomosaic
for April 2015. Extreme overlapping of class samples (rep-
resented by colour) due to similar pixel values can be noted.
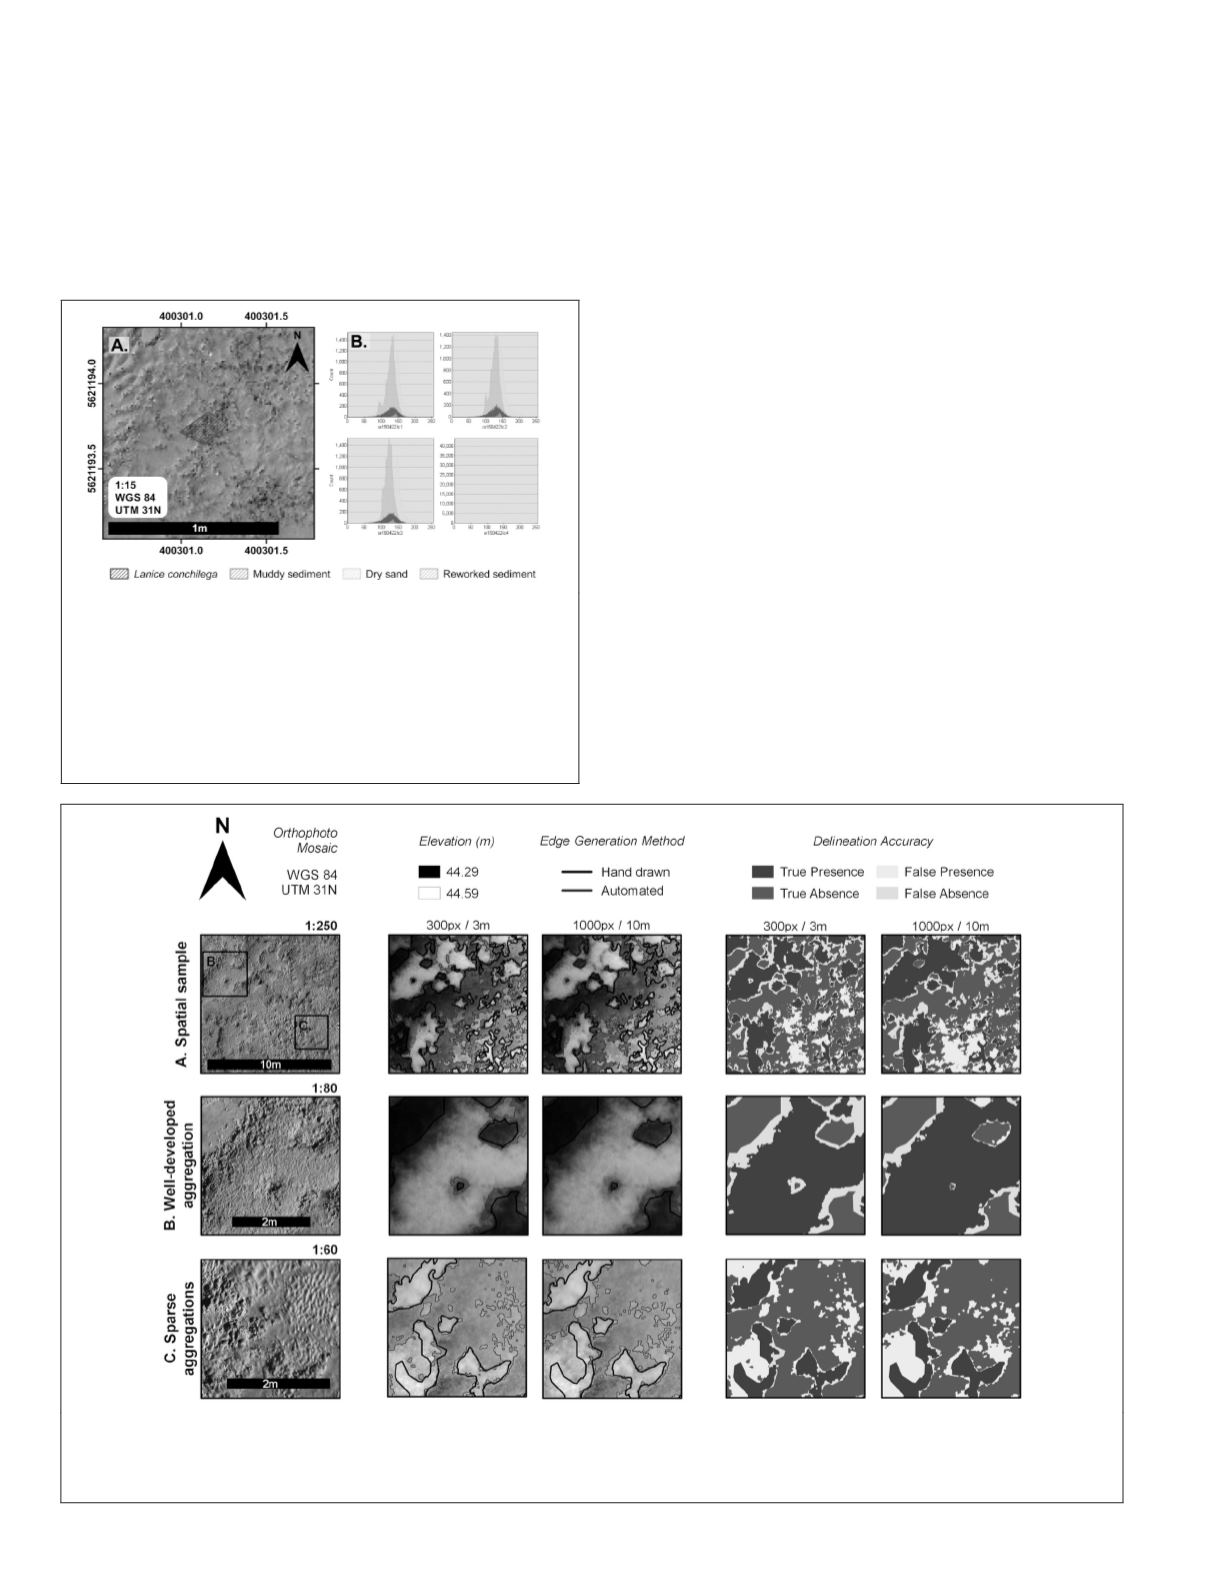
Figure 3. (a) The window size used to average elevation during
MES
construction affected delineation accuracy by impacting the
final position of automated edges on elevation slopes, creating spatial patterns. (b) The use of smaller window sizes (e.g., 300 px/3
m) resulted in lower accuracy in areas with well-developed aggregations than employing larger
MES
window sizes (e.g., 1000 px/10
m). (c) Conversely, accuracy was higher if small windows were used in areas of sparse distribution than larger averaging windows.
902
December 2019
PHOTOGRAMMETRIC ENGINEERING & REMOTE SENSING


