Comparisons were also made with
WELD
composites to
illustrate the differences between compositing methods.
WELD
summer composites for 2010 and 2011 were re-tiled
to the
LF
2012 tiling system and used to run the
LF MIICA
change detection algorithm. Plate 4 shows 2011 leaf on tiled
imagery from
LF
2010,
LF
2012, and
WELD
with 2010 to 2011
leaf on
MIICA
results for tile “r7c11,” which covers portions
of Mississippi, Alabama, and Tennessee. Visible differences
exist between the images and
MIICA
results. The most obvious
differences are the amount of masked pixels (white) in the
LF
2010
MIICA
results, scan line artifacts in the
WELD
imagery
and
MIICA
output, and the amount of change detected by
MIICA
using each of the three image sources from the same time pe-
riod.
LF
analysts who manually processed every
LF
2010 scene,
and also processed each
LF
2012 tile indicated a qualitative
increase in the ability to detect and classify landscape change
using the
LF
2012 process. Visual inspection of the 2010 to
2011
WELD MIICA
results, in comparison with the
LF
2012
MIICA
results, showed a general increase in the amount of change
mapped in the
LF
2012 data, with more anomalous change
flagged in the
WELD
data, as illustrated in Plate 4.
Discussion and Conclusions
Advantages to Tiled Approach
Moving from the previous individual scene-based processing
to tile-based processing resulted in several advantages. Scene
selection was able to be fully automated, compared to previ-
ous updates, which required manual selection of scenes to
achieve the best combination of seasonally matching scenes
of greatest image quality. Even with trained analysts viewing
every available scene, there were many cases where the best
available scenes had significant cloud cover and seasonality
did not match well between image dates because of limited
scene availability.
By using the best portions of every available scene, the
composited tile approach resulted in scenes of greater image
quality with more tightly controlled seasonal dates, reduc-
ing the impact of phenological changes between years. The
number of images to be processed post-
MIICA
was reduced
by 78 percent; whereas in previous
LANDFIRE
updates, 445
individual scene frames were mapped by analysts, only 98
tiles were needed to cover the same area. The size of each tile
was only slightly larger than the size of the re-projected single
images, though there were more data within each tile, the fill
area being replaced with pixels from neighboring scenes to fill
the entire tile extent with valid data, each pixel only needed
to be mapped once, eliminating the redundant processing of
overlap areas.
The results shown in Plate 4 were similar for other por-
tions of the country. In general, the
LF
2012 change detection
results had much less area masked out due to clouds and
cloud shadows than
LF
2010, allowing more change to be
detected. Conversely, when no reasonable data existed for a
given pixel, a no-data value was assigned, preventing anoma-
lies in the change detection results as seen in the
WELD
data
where all pixels are given valid data, even if all available
images are cloudy.
Limitations
Several limitations in the developed tiling and composit-
ing approach led to decreased image quality in some areas.
The use of static target dates across the entire country likely
contributed to the phenology-related issues described above.
A more reasonable approach might be to define regional target
dates that consider phenology patterns of local vegetation
and cloud dynamics to optimize the time periods desired for
compositing. For example, no scenes were selected between
days 1 to 99 or days 300 to 365 (or 366). In some areas, espe-
cially the southeastern United States, images from these time
periods may be appropriate. Adjusting the time period for a
particular region would require only simple modifications
to existing processing scripts to implement, once the desired
date ranges were identified.
Improvements to the cloud, cloud shadow, water, and
snow/ice masks could reduce the prevalence of undesired
data in the final composites. The
LEDAPS
masks were chosen
for the
LANDFIRE
process based on an evaluation of several
different automated data masking routines that found the
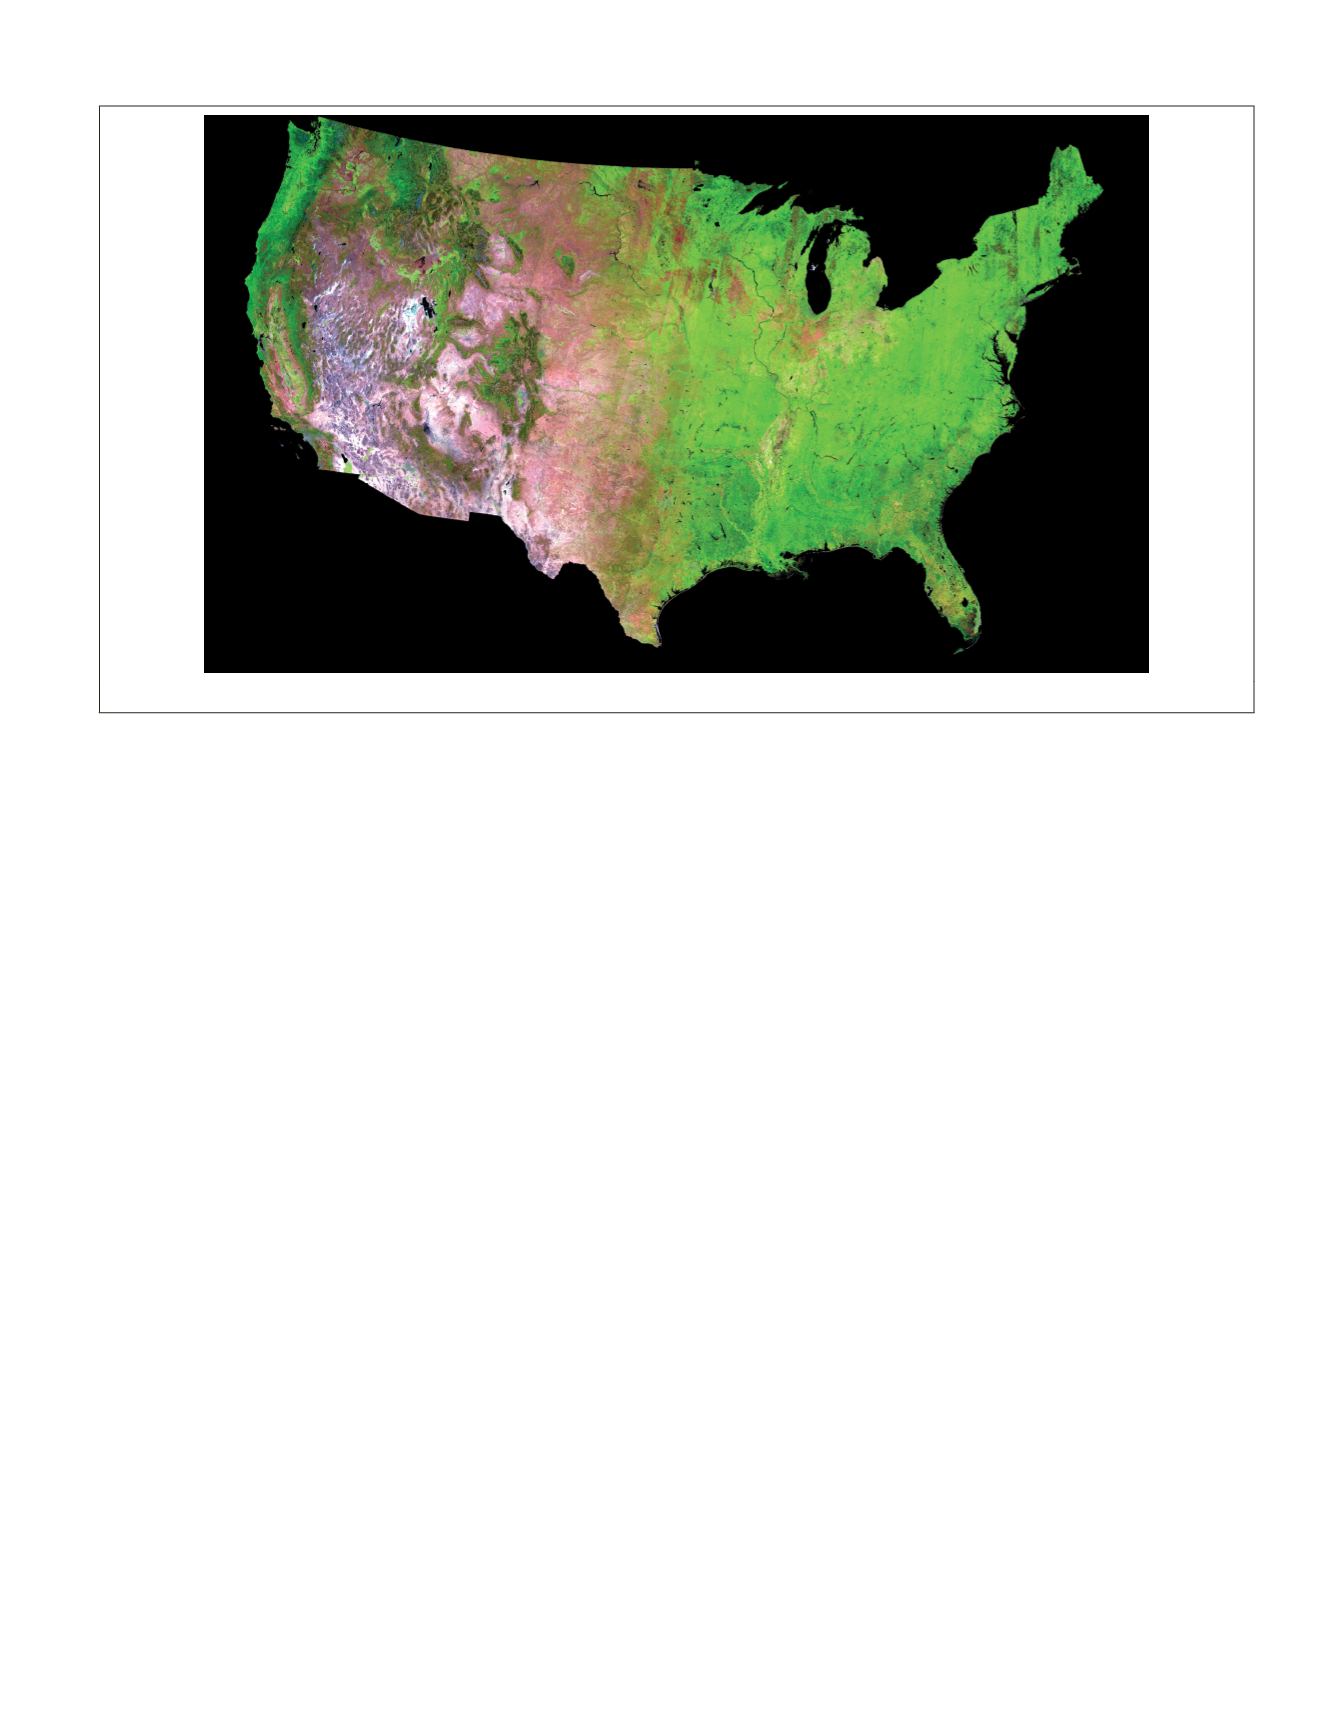
Plate 3. 2012 day 175 composite mosaic.
PHOTOGRAMMETRIC ENGINEERING & REMOTE SENSING
July 2015
583


