across all available years. More disturbance was mapped
in 2011 and 2012 than any previous year, which suggests
that the
LF
2012 process is able to capture more change than
previous
LANDFIRE
processes, though without further valida-
tion this finding is not definitive. Comparing the disturbance
mapped by
MIICA
between 2010 and 2011 between the
LF
2010
and
LF
2012 datasets showed a similar trend. In the leaf-on
dates, 46 million hectares were mapped as decreased biomass
disturbance using the
LF
2010 tiles derived from the indi-
vidual scenes (see above) compared to 55.1 million hectares
mapped using the
LF
2012 composites. In the leaf off dates,
43.2 million hectares were mapped as decreased biomass
disturbance using
LF
2010 data compared to 44.5 million
hectares using the
LF
2012 data. The amount of disturbance
mapped by
MIICA
is much greater than the amount of dis-
turbance captured in the
LANDFIRE
final products because of
the filtering and verification processes that
LANDFIRE
uses to
remove undesired, ephemeral, or suspect changes from the
disturbance data.
T
able
3. T
otal
A
mount
of
D
isturbance
A
rea
(
in
ha
)
M
apped
by
landfire
in
conus
by
Y
ear
Year
CONUS disturbance mapped (ha)
1999
3,717,315
2000
4,038,028
2001
2,907,001
2002
3,472,909
2003
3,347,009
2004
2,485,192
2005
3,755,944
2006
5,660,811
2007
5,482,051
2008
6,860,149
2009
6,203,863
2010
4,760,375
2011
9,320,719
2012
7,520,909
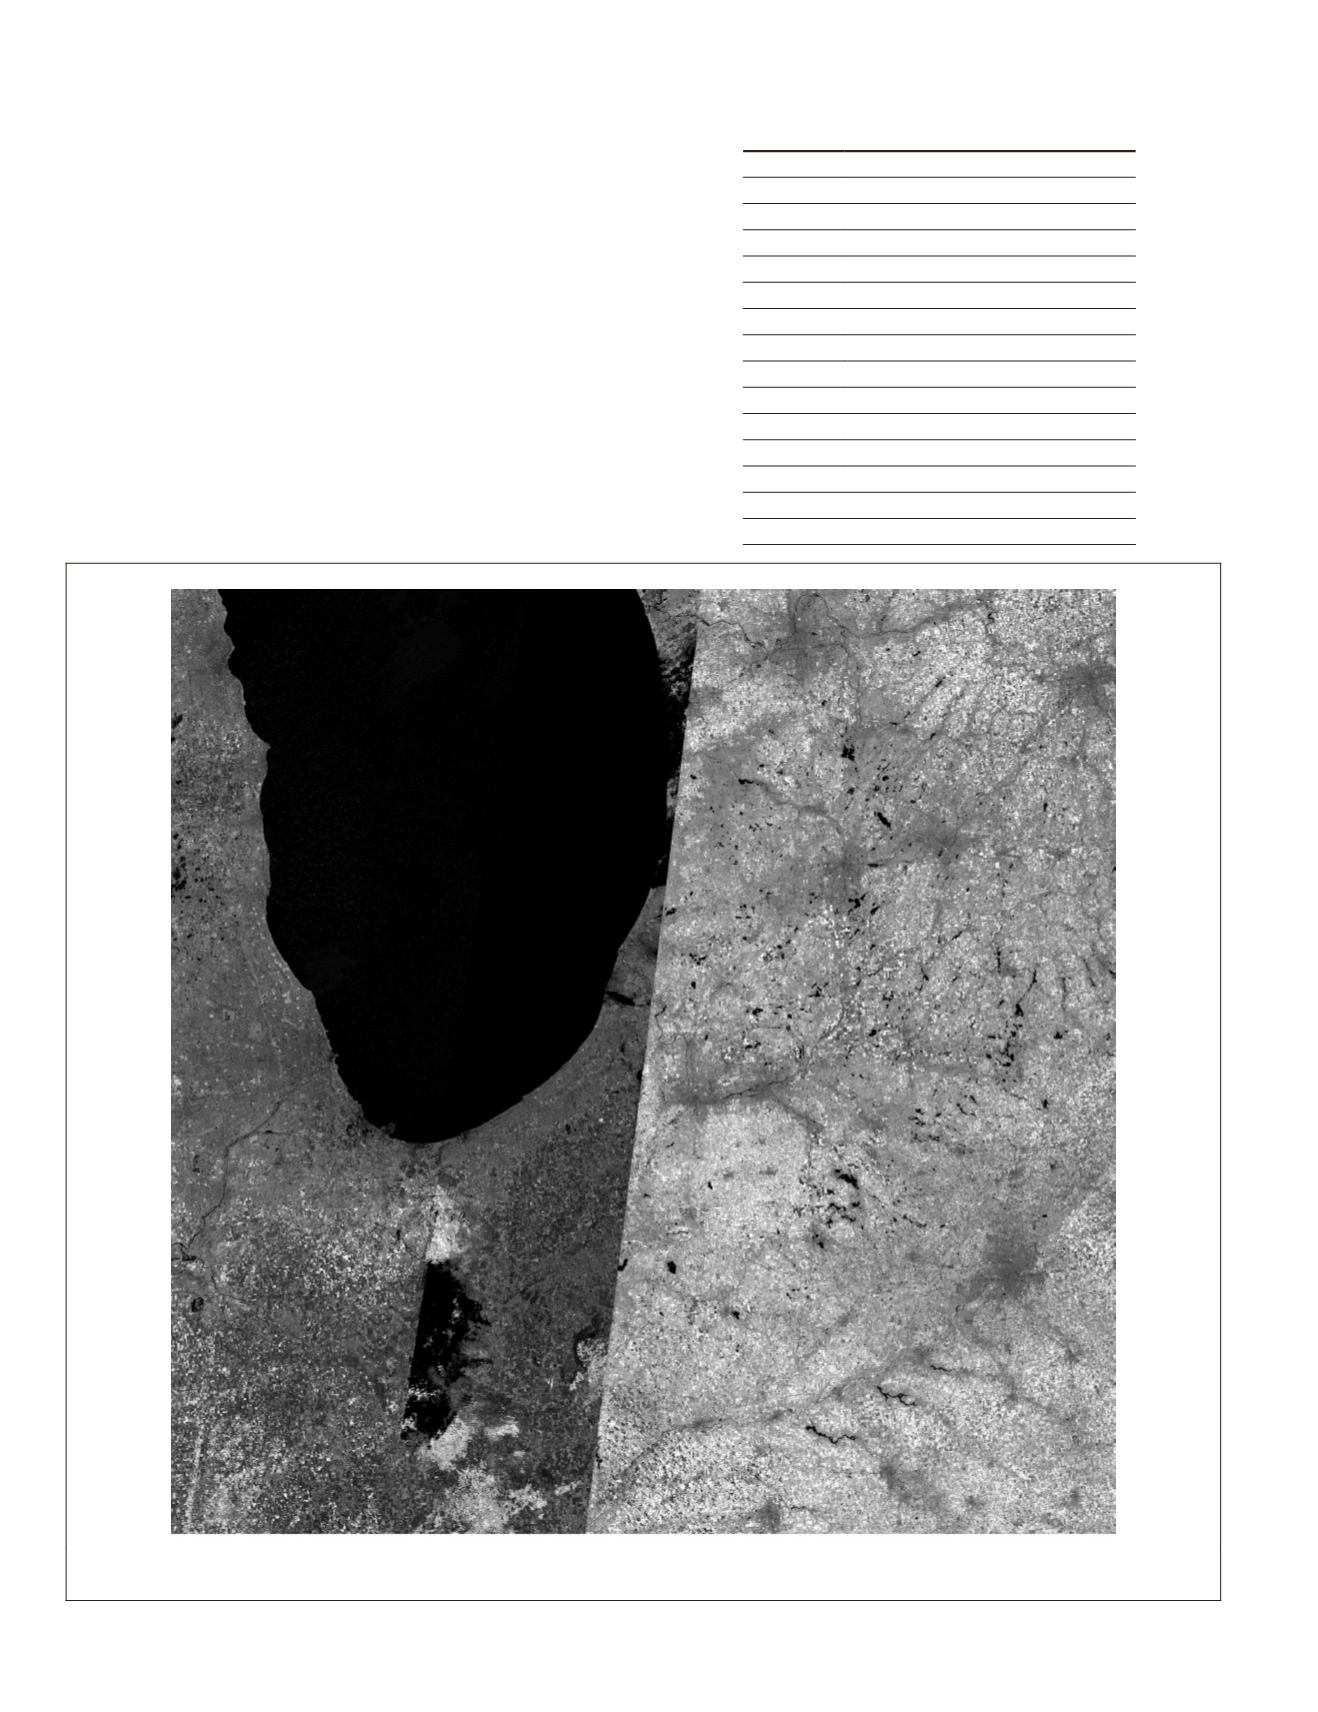
Figure 4. Example of phenological changes between scenes in agricultural areas, tile r4c11, 2011 day 250, band-4 surface reflectance,
covering portions of Wisconsin, Illinois, Indiana, Michigan, and Ohio.
582
July 2015
PHOTOGRAMMETRIC ENGINEERING & REMOTE SENSING


