LEDAPS
masks to be consistently the most useful for all desired
features, and the convenience of already using the
LEDAPS
data produced from
ESPA
led to a seamless processing system.
Since that evaluation, there has been further development of
the FMask algorithm (Zhu and Woodcock, 2012), which is
also now being used within
ESPA
. Additionally, it is expected
that the data masking algorithms in the
OLI QA
process will be
further developed and improved over time as well. Re-eval-
uation of these and other recently published methods would
be prudent before future updates commence. Similarly,
SR
al-
gorithms for
OLI
data were not available in time for this effort.
The mixture of
TM
and E
TM
+ data corrected to
SR
and
OLI
data
corrected to
TOA
reflectance within
MIICA
likely contributed
to some level of error in the resultant change products. As the
OLI
data and processing algorithms mature, corrections for
OLI
data to
SR
will be forthcoming and will be tested for future
updates. Previous studies have used relative normalization
algorithms with Landsat imagery corrected to
TOA
reflectance
in lieu of correcting to
SR
(e.g., Potapov
et al.
, 2012). Relative
normalization of the
OLI
data was briefly considered but not
implemented largely because of processing and project time
constraints plus the lack of research into relative normal-
ization algorithms using
OLI
data. Until an operational
SR
algorithm for
OLI
data exists, further research into relative nor-
malization of
OLI
data is warranted and may result in higher
quality composite data.
An additional area that could be improved in future up-
dates is the selection of the compositing function or “best-pix-
el” algorithm. While the algorithm used here proved useful
over much of the landscape, its sensitivity to undesired data
values (i.e., unmasked cloud or shadow) and phenology led
to composites that were degraded in some areas. Subsequent
work is being conducted based on the premise that a single
compositing criterion may not be optimal for producing data
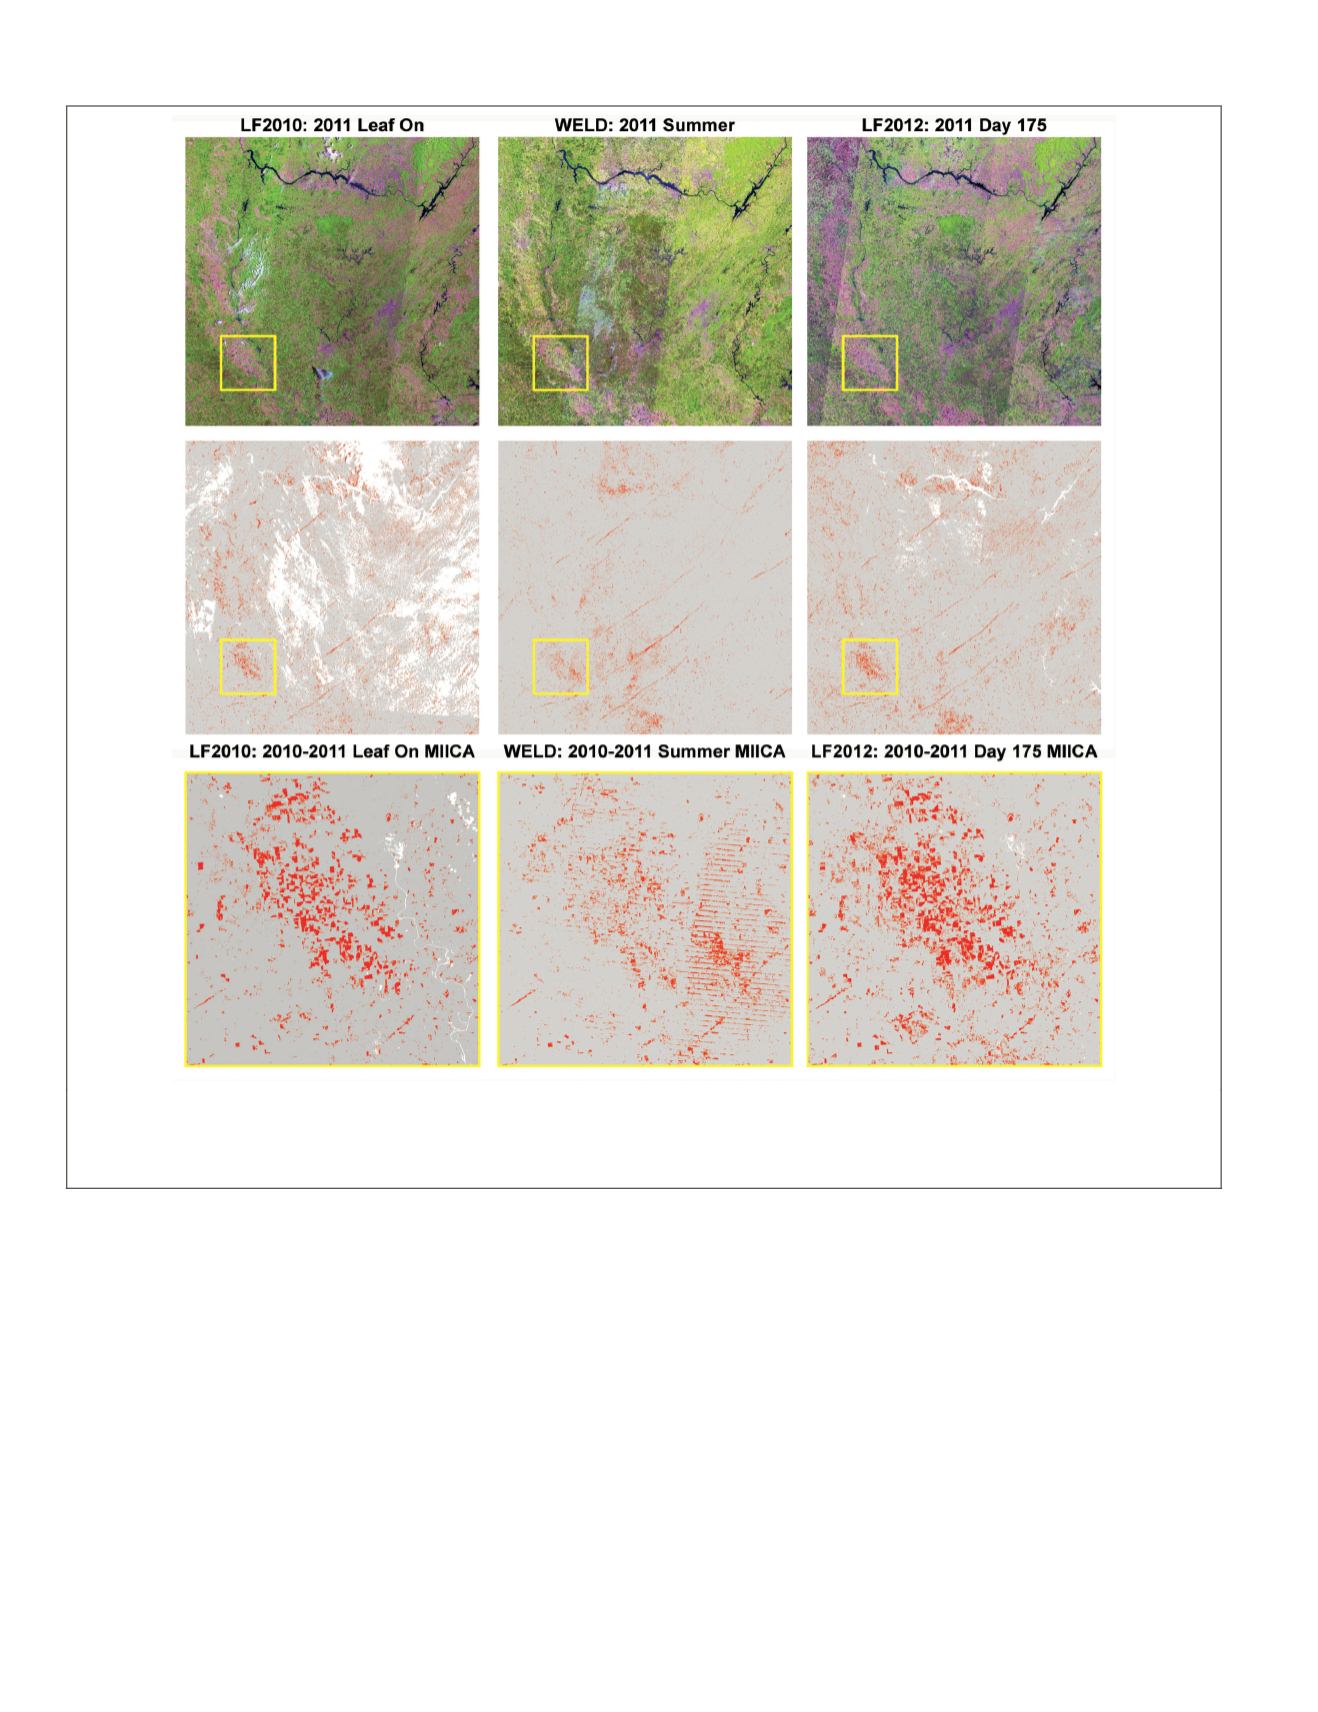
Plate 4. Source imagery and
miica
outputs for tile r7c11 covering Mississippi, Alabama, and Tennessee. Left column shows 2011 leaf on
single scene images mosaiced to the tile boundary from LF2010, 2010 to 2011 leaf-on MIICA output with grey being no change, red as de-
creased biomass, and white as masked out; the bottom image is a close up view of the area indicated by the yellow box. The center column
shows the results using
weld
2010 and 2011 summer composites. The right column shows the results using LF2012 tiled composites.
584
July 2015
PHOTOGRAMMETRIC ENGINEERING & REMOTE SENSING


