a decreasing trend and changed from positive to negative as
the slope increased, except that the value for the 25° to 35°
slope level was slightly greater than that for the 15° to 25°
level. Mean errors in the 0° to 2° level were positive but nega-
tive in the other levels. The smallest elevation error was 0.05
m for the 0° to 2° level, while the largest error was -0.86 m at
the >35° level. In terms of the standard deviation, the overall
variation in the errors increased with increasing slope, but the
minimum variation in the errors occurred at the slope level
of 2° to 5°, the standard deviation range from 3.98 to 17.51.
Although the maximum positive and negative errors were
relatively large and at a magnitude of hundreds, the large er-
rors made up a small proportion of the entire sample with the
90 percent error exceeding 16 m only in the >35° level.
Table 3 presents the basic statistics for the
SRTM
elevation er-
rors for different aspects. The mean errors were smaller in south-
western directions than that in northeastern directions. The
errors in most directions were negative while the positive errors
only distributed in the northern directions of 0° to 45° and 315°
to 360°. The largest negative error was -0.44 m and located in
the direction of 225° to 270°, the largest positive error was 0.08
m and located in the direction of 0° to 45°. The variations in the
standard deviation and 90 percent errors were not obvious in
different directions (5.5 ±1 and 6.8 ±0.2 m, respectively), which
meant a slight variation of errors in different aspects.
Further statistics revealed that the same pattern of smaller
mean errors in the southwestern directions and larger mean
errors in the northeastern directions was observed for various
aspects at different slope levels. Meanwhile, the mean errors
showed a smaller proportion of positive errors for higher slope
levels. In most aspects, the elevation errors in different slope lev-
els also tended to decrease numerically with increasing slope.
The mean errors of the different slope levels varied within a
range from -0.86 m to 0.05 m with an interval of 0.91 m, and the
standard deviation varied from 3.98 to 17.51. The mean error for
various aspects varied from −0.44 m to 0.08 m with an interval
of 0.52 m, and the standard deviation fluctuated around a value
of 5. All of the above indicates that among the topographic fac-
tors, slope has a larger impact on the
SRTM
errors than aspect.
SRTM Errors and Vegetation
Rules similar to those used for the topographic factors were
followed in the analysis of the relationship between the
SRTM
elevation errors and vegetation cover. First, the sample points
in the deserts, glaciers, built-up urban areas, and wetlands
were ruled out, but the difference in this part was that only
the sample points with vegetation coverage greater than 5
percent were included. The sample points for the vegetation
factor defined in this way were primarily distributed in the
hilly areas and low mountains in northeastern China and most
parts of central and southern China. The area can be seen in
Figure 10 labeled as vegetation areas. The total number of
samples was 213,449 that accounted for 41.53 percent of the
entire sample set with
SRTM
data abnormalities excluded and
had a mean error of 0.02 m with a standard deviation of 10.46.
The
SRTM
elevation errors in these areas were influenced
by the joint effects of variations in vegetation cover and topo-
graphic attributes. The previous analysis indicated that slope
had a greater impact on the errors than aspect. Thus, only the
impact of the slope was also considered when analyzing the
characteristics of
SRTM
elevation error for areas with vegeta-
tion coverage greater than 5 percent.
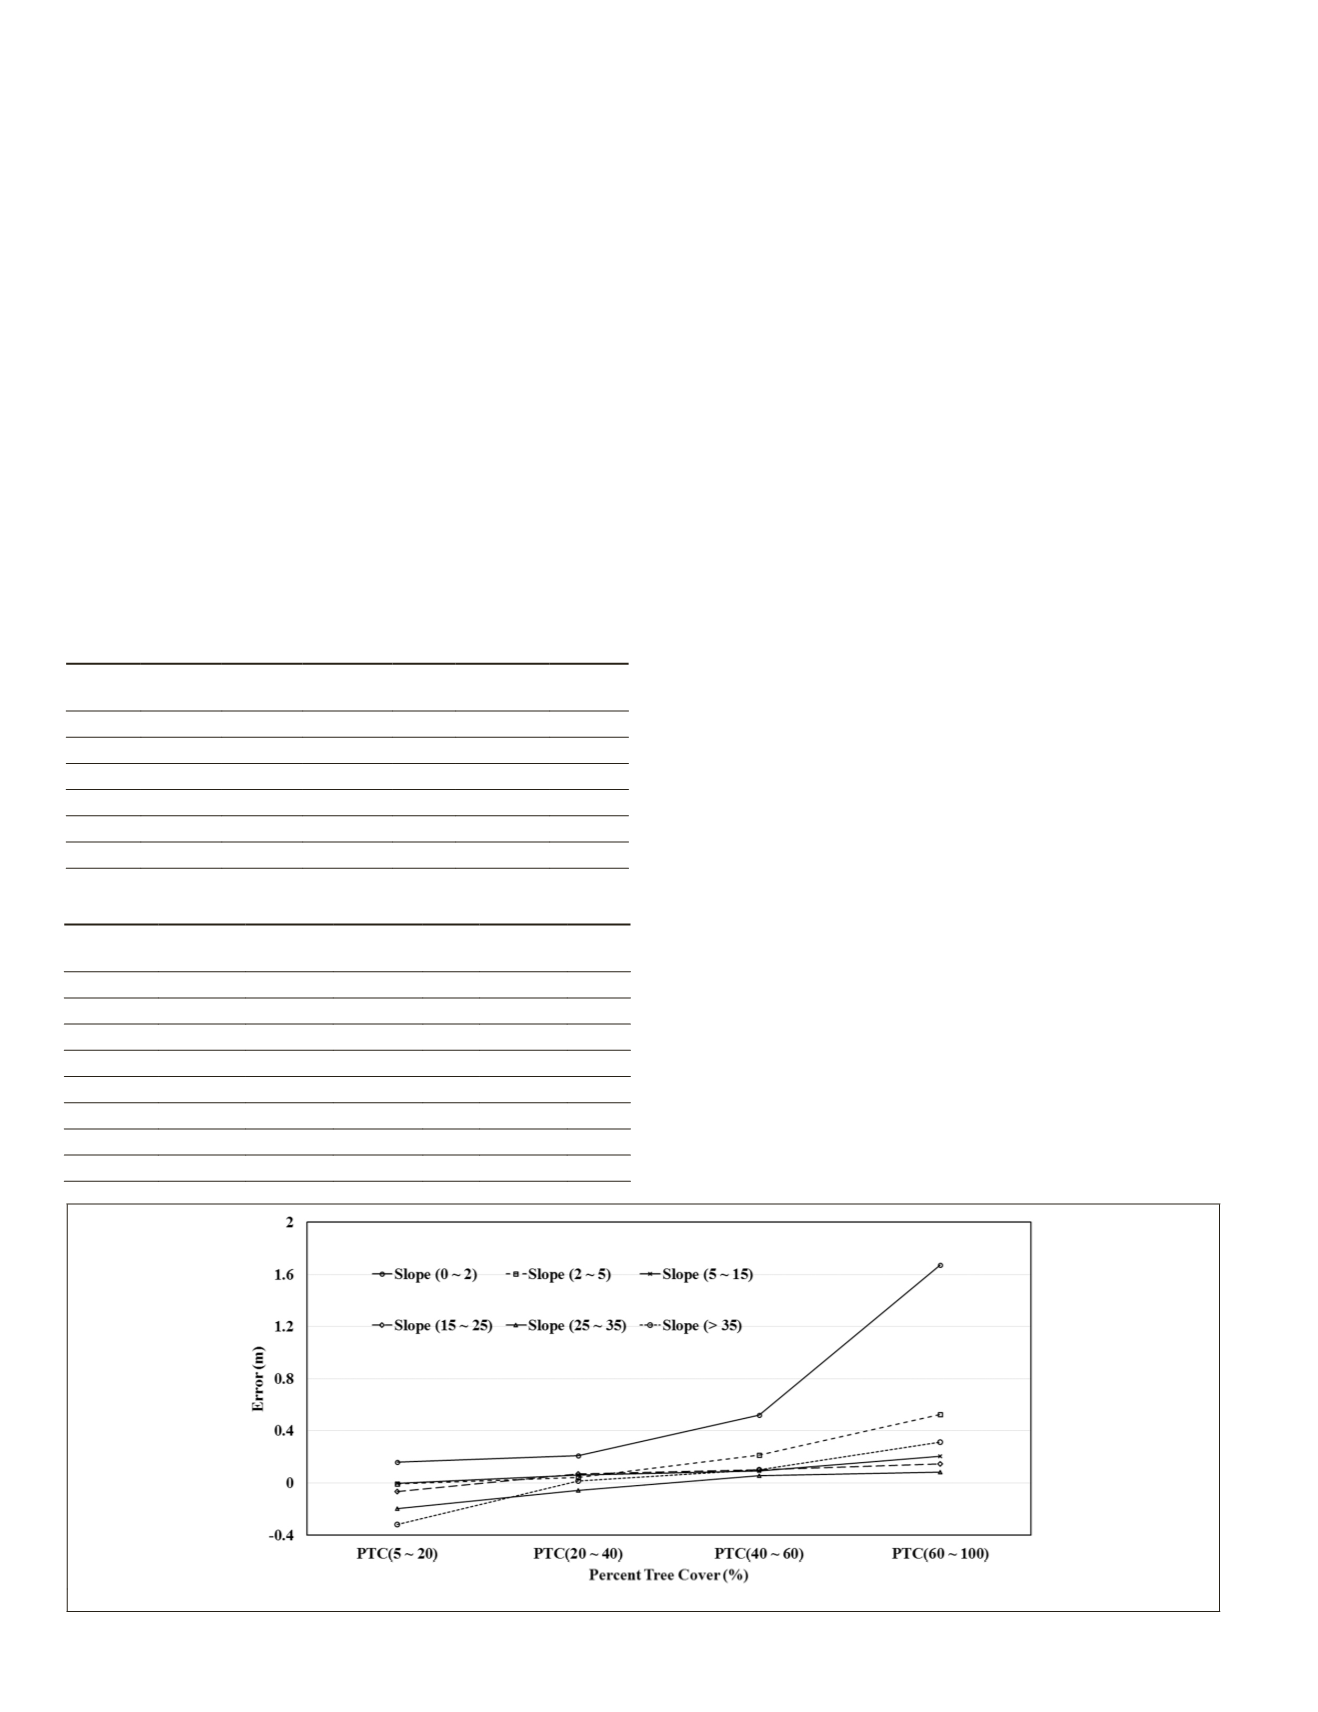
Figure 12 demonstrates the change in mean elevation errors
of the
SRTM
data with vegetation coverage at different slope
levels. At all slope levels, the value of the errors increased
monotonically with increasing vegetation coverage. However,
only the mean error at 0° to 2° slope level was positive for all
the levels of vegetation coverage and varied from 0.15 m to 1.67
m. For other higher slope levels, the mean errors were small
for all levels of vegetation coverage due to the impact of slope,
which could be negative in the low levels of vegetation cover-
age indeed. The >35° slope level contained the smallest error
Figure 12. Relationship of SRTM error and vegetation coverage in different slope levels; PTC represents Percent Tree Cover.
T
able
2. S
tatistical
C
haracteristics
of
the
E
levation
E
rror
V
ariation
in
the
S
lope
S
ample
T
ype
Slope(°) Min(m) Max(m) Mean(m) STD
90%
Error(m)
Size
(m
2
)
0 to 2 -220.38 153.71 0.05 4.29
5.9 98,603
2 to 5 -174.51 283.48 -0.19 3.98
4.5 45,082
5 to 15 -232.15 315.64 -0.36 4.13
5.0 50,940
15 to 25 -464.12 287.72 -0.48 7.48
8.5 24,670
25 to 35 -208.62 174.36 -0.45 9.29 12.9 14,137
>35 -201.92 406.30 -0.86 17.51 18.6 3,651
T
able
3. S
tatistical
C
haracteristics
of
the
E
levation
E
rror
V
ariation
in
the
A
spect
S
ample
T
ype
; F
lat
T
errain with
S
lope
of
0
was
E
xcluded
Aspect(°) Min(m) Max(m) Mean(m) STD
90%
Error(m)
Size
(m
2
)
0 to 45 -177.86 315.64 0.08 5.16 6.6 35,498
45 to 90 -464.12 182.41 -0.03 6.17 6.7 26,064
90 to 135 -174.51 188.94 -0.13 5.37 6.8 23,915
135 to 180 -166.77 130.04 -0.37 4.98 6.8 34,975
180 to 225 -284.23 287.72 -0.43 6.04 7.0 35,868
225 to 270 -208.62 119.21 -0.44 5.41 6.9 24,689
270 to 315 -106.45 119.45 -0.21 5.03 6.8 22,001
315 to 360 -162.90 406.30 0.04 5.65 6.7 33,439
144
February 2016
PHOTOGRAMMETRIC ENGINEERING & REMOTE SENSING


