of −0.32 m. It can be concluded that variations in slope have a
greater impact on the elevation error than vegetation coverage.
Changes in the elevation error of the
SRTM
data with
respect to the vegetation coverage at different slope levels
indicated that the elevation error was rarely affected by slopes
between 0° and 2°. This could be taken to reflect the general
pattern of changes in errors with respect to vegetation cover-
age; and the basic statistics are listed in Table 4. The mean
elevation errors increased with increasing vegetation cover-
age, and the standard deviation of the errors also showed a
slightly increasing trend. Furthermore, the 90 percent errors
varied only slightly with the vegetation coverage.
SRTM Errors and Land Covers
Figure 2 shows the spatial distribution of different land cover
types in China. Glacier-covered areas are primarily located
in the mountains where they create large areas in
SRTM
hav-
ing data abnormalities giving a maximum negative error of
−1,223.99 m and a maximum positive error of 524.91 m.
Similarly, there were large areas of
SRTM
with anomalies in
the deserts, which led to a maximum positive error of 58.81 m
and a maximum negative error of −95.47 m. In the wetlands
that were sensed during a freezing winter in February, both
the maximum positive and negative errors were relatively
small. The error of only one sample point exceeded the speci-
fication and reached −19.40 m. Although densely built-up
areas were topographically flat, the maximum positive and
negative error reached ±17 m because of the presence of high
buildings and deep open pits. The statistics for the sample
points in the glaciers, deserts, and urban areas that exclude
the data abnormalities are presented in Table 5.
Among these four land-cover types, the proportion of
sample points in Desert and Built-up areas was much higher
than that in the Glacier and Wetland areas. The statistics in-
dicated that the mean errors in glaciers, deserts and wetlands
were negative at −1.05 m, −2.03 m, and −2.43 m, respectively,
while the mean error of the building-covered areas was posi-
tive at 1.05 m. This observation supported the suggestion that
penetration of radar signals in glaciers, deserts and wetlands
(in freezing winters) can cause an underestimation of the
SRTM
elevation of the actual surface. The overestimation of
the actual surface
SRTM
elevation in the building-dense areas
is also consistent with the height measurement of
SRTM
being
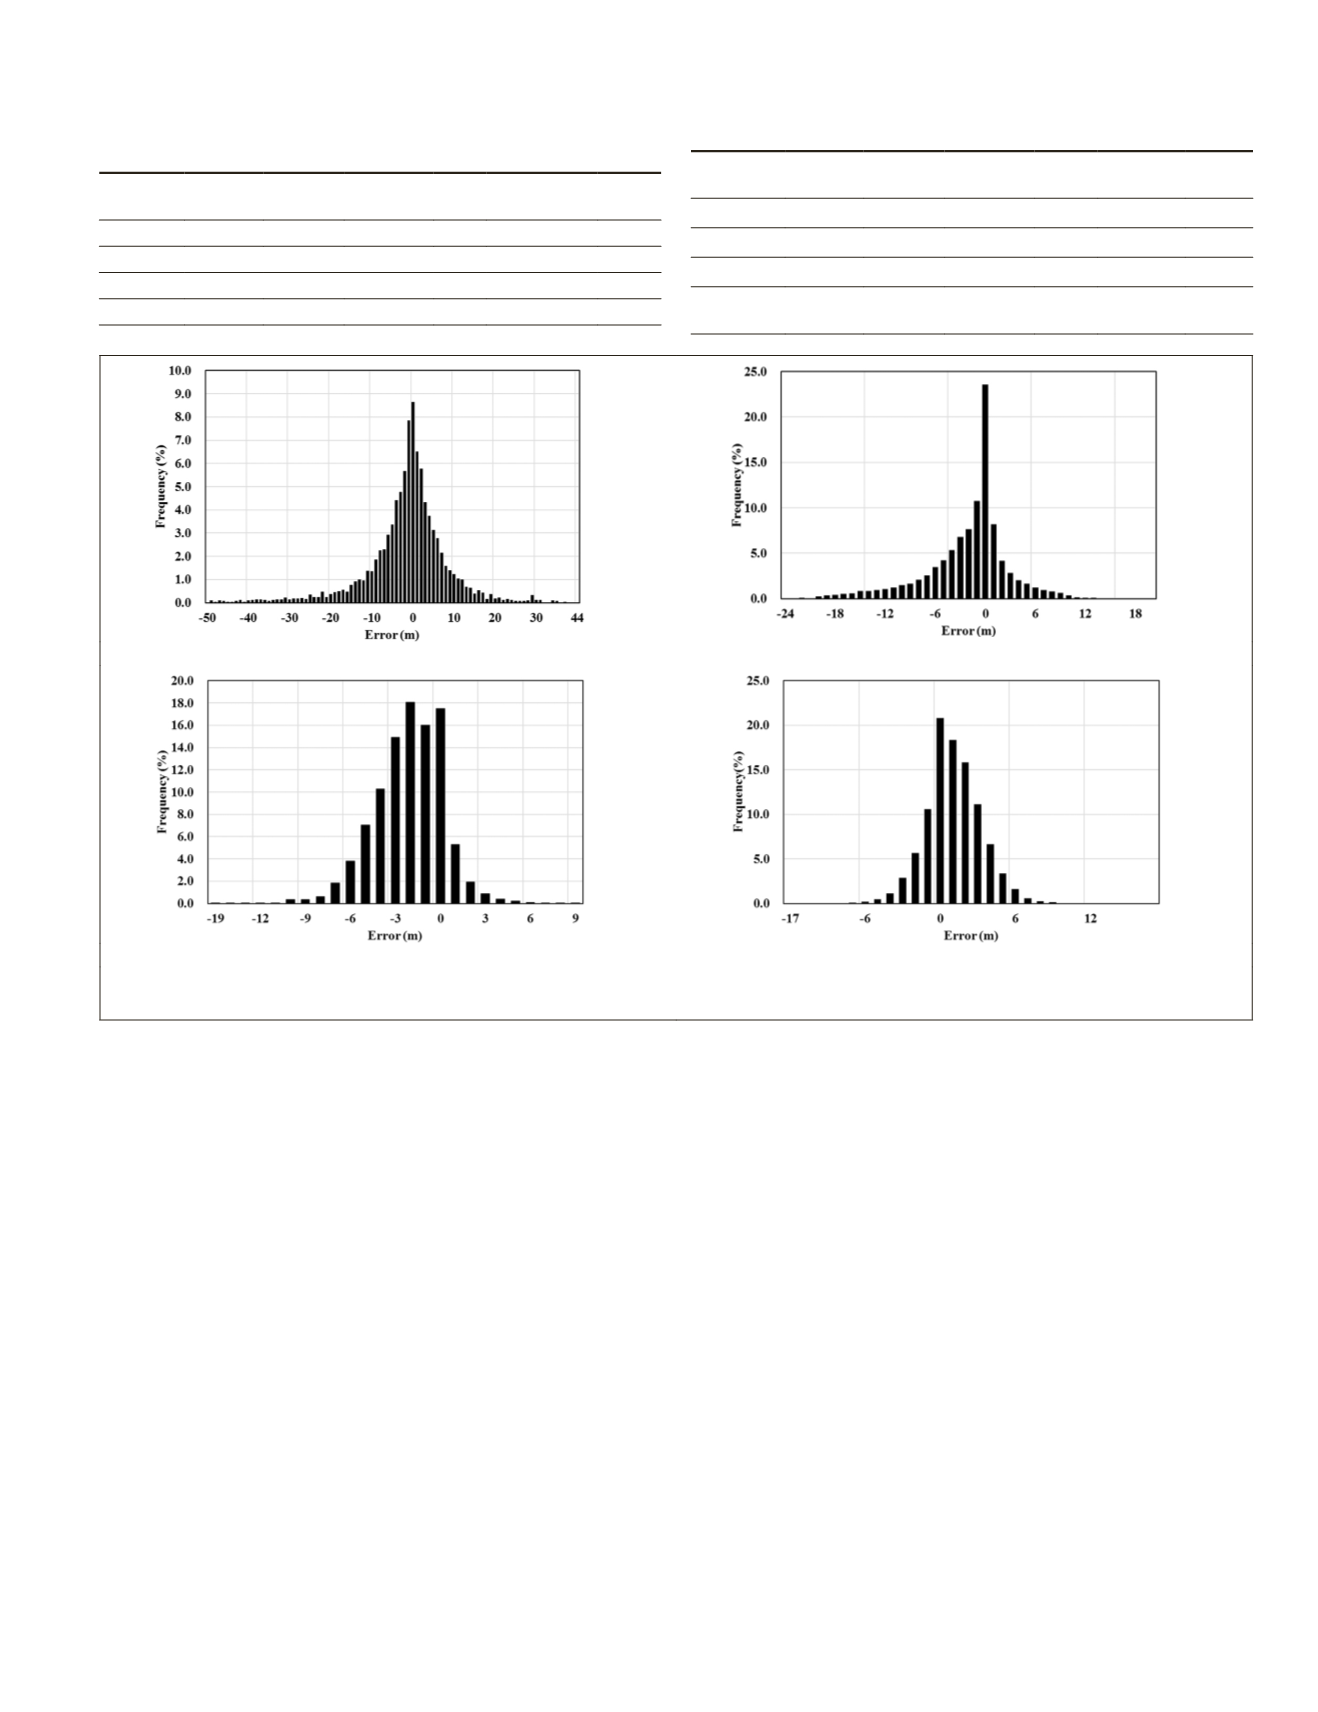
above the bare ground. These characteristics were also reflect-
ed in histograms of the error in these four surface cover types
(Figure 13). The error associated with glaciers, deserts, and
wetlands showed a slightly negatively skewed distribution,
and that associated with building-covered areas was positive-
ly skewed. The standard deviation of the errors revealed that
the magnitude of the change in elevation errors was smallest
for wetlands and built-up urban areas, in the middle for the
deserts and highest for the glaciers. Wetlands and built-up
T
able
4. S
tatistical
C
haracteristics
of
the
R
elationship
between
the
SRTM
E
levation
E
rror
and
V
egetation
C
overage
in
the
S
lope
R
ange
of
0°
to
2°;
PTC
represents
P
ercent
T
ree
C
over
PTC(%) Min(m) Max(m) Mean(m) STD
90%
Error(m)
Size
(m
2
)
5 to 20 -43.91 88.72 0.15 3.54
4.8
29,353
20 to 40 -31.60 67.94 0.22 3.55
4.9
6,423
40 to 60 -19.80 35.20 0.52 3.76
5.5
1,613
60 to 100 -13.01 17.57 1.67 4.39
8.1
341
T
able
5. S
tatistical
C
haracteristics
of
the
SRTM E
rrors
in
G
laciers
, D
es
-
erts
, U
rban
B
uilt
-
up
A
reas
and
W
etlands without
D
ata
A
nomalies
Sample
type
Min(m) Max(m) Mean(m) STD
90%
Error(m)
Size
(m
2
)
Glacier -346.71 275.50 -1.05 19.97 19.6 4,335
Desert
-95.47 42.12 -2.03 5.16 9.6 37,804
Wetland -14.10 8.87 -2.43 2.30 5.0 5,598
Urban
Built-up
-11.02 17.17 1.05 2.23 4.0 17,697
(a)
(b)
(c)
(d)
Figure 11. Frequency distribution of the SRTM error in areas with different landscape features: (a) Glaciers, (b) Deserts, (c) Wetlands, and
(d) Built-up areas.
PHOTOGRAMMETRIC ENGINEERING & REMOTE SENSING
February 2016
145


