interference from these abnormal areas on the subsequent
analysis of the elevation errors, the sample points in these
abnormal areas were excluded so that the statistical results
would be more widely applicable.
Relation between Terrain and Land Cover Factors and SRTM Errors
SRTM Errors and Topography
The topographic factors that affected the
SRTM
elevation error
included slope and aspect. For this part, the sample points
located in built-up urban areas, deserts, glaciers, and wetlands
were excluded. Additionally, to reduce the impact of variations
in vegetation coverage, the sampling points with vegetation
coverage less than 5 percent were selected from the remaining
sample points. This assumes that the impact of the vegetation
in these areas on the
SRTM
data could be ignored due to the
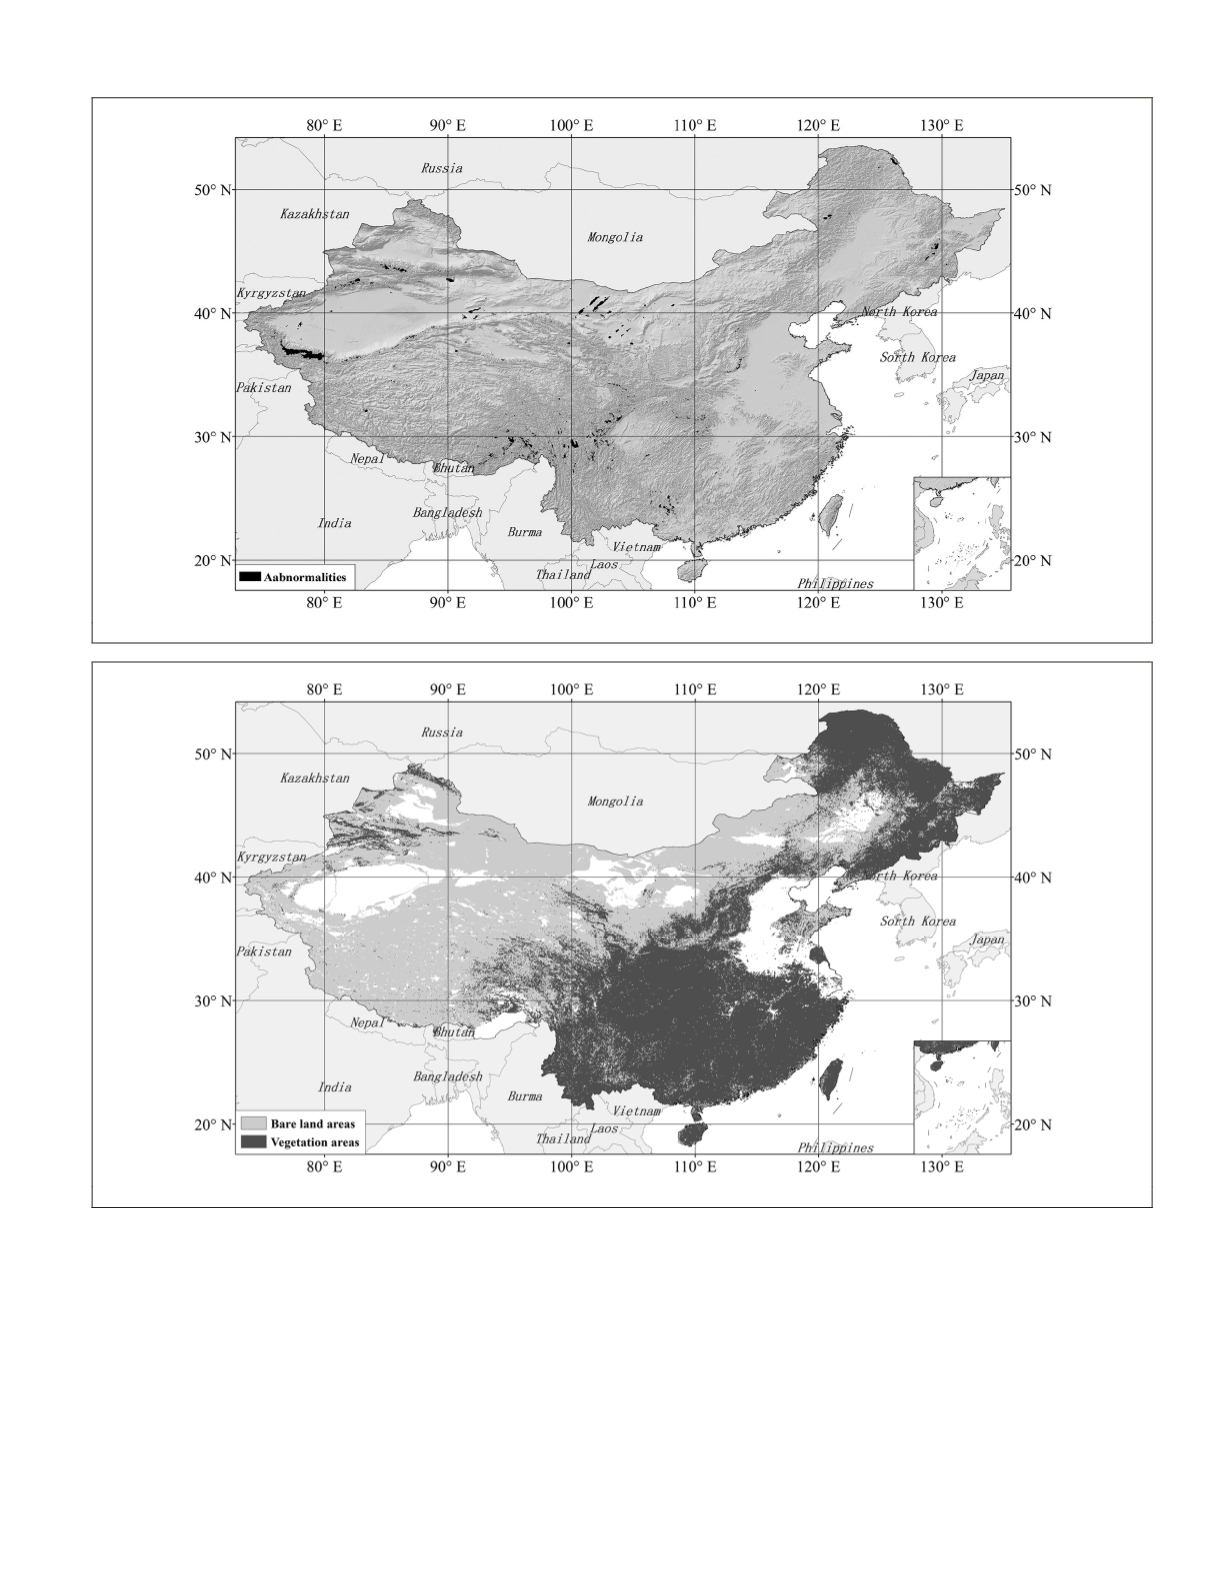
low vegetation density and height. Finally, the sample points
selected for topographic factors were primarily distributed in
the west part and the northern middle part of China as seen
in Figure 11 labeled as bare land areas. The total number of
samples was 237,083, which accounted for 46.13 percent of
the entire sample without
SRTM
data abnormalities, and had a
mean error of 0.18 m with a standard deviation of 5.48.
Table 2 lists the basic statistics for the elevation errors of
SRTM
data for different slope levels. The mean errors showed
Figure 10. Spatial distribution of obvious abnormalities in China.
Figure 11. Regions for topography and vegetation factors.
PHOTOGRAMMETRIC ENGINEERING & REMOTE SENSING
February 2016
143


