(
RCG
), typha marsh (
TM
), wet-mesic prairie (
WMP
), or woody
vegetation (
WV
). A binary classifier (1 or 0) was used to denote
the presence of image artifacts and image blur. Image artifacts
are regions of the image where pixels have been misaligned
and result in distinct visible errors. Image blur occurs when
the quality of the output has a blurred appearance (Figure 2).
Chi Square tests for independence were calculated between
image groups (i.e., Pix4D versus
ICE
). Chi Square tests allow
for the comparison of binary data to determine if there are
differences between two or more groups
(i.e., more occurrences of image artifacts
in one group than another). For this
study the commonly applied alpha of
.05 was used. In cases where Chi Square
tests could not be used (typically when
the number of observations per group
is low) fisher’s exact tests were used.
In this study, comparisons between
vegetation classes for each software (i.e.,
Pix4D
WV
versus Pix4D
TM
) had suffi-
ciently low numbers of observations to
warrant the use of fisher’s exact tests. In
order to deal with the issue of multiple
comparisons (the increased likelihood
of false positives due to chance when
conducting multiple tests) Bonferroni
corrections were applied as necessary
(Heumann, In Press; see McDonald,
2014 for a more detailed discussion).
Results and Discussion
Geometric Accuracy
The results of this analysis can be
viewed in Figure 3 and Table 4. Overall,
ICE
produced the least geometrically
accurate image with an
RMSE
of 34.7 cm
compared to Pix4D and Photoscan Pro
(Tukey test p <0.05). Pix4D produced
the lowest
RMSE
of 7.7 cm, however, this
value was not found significantly differ-
ent from Photoscan Pro’s
RMSE
of 10.9
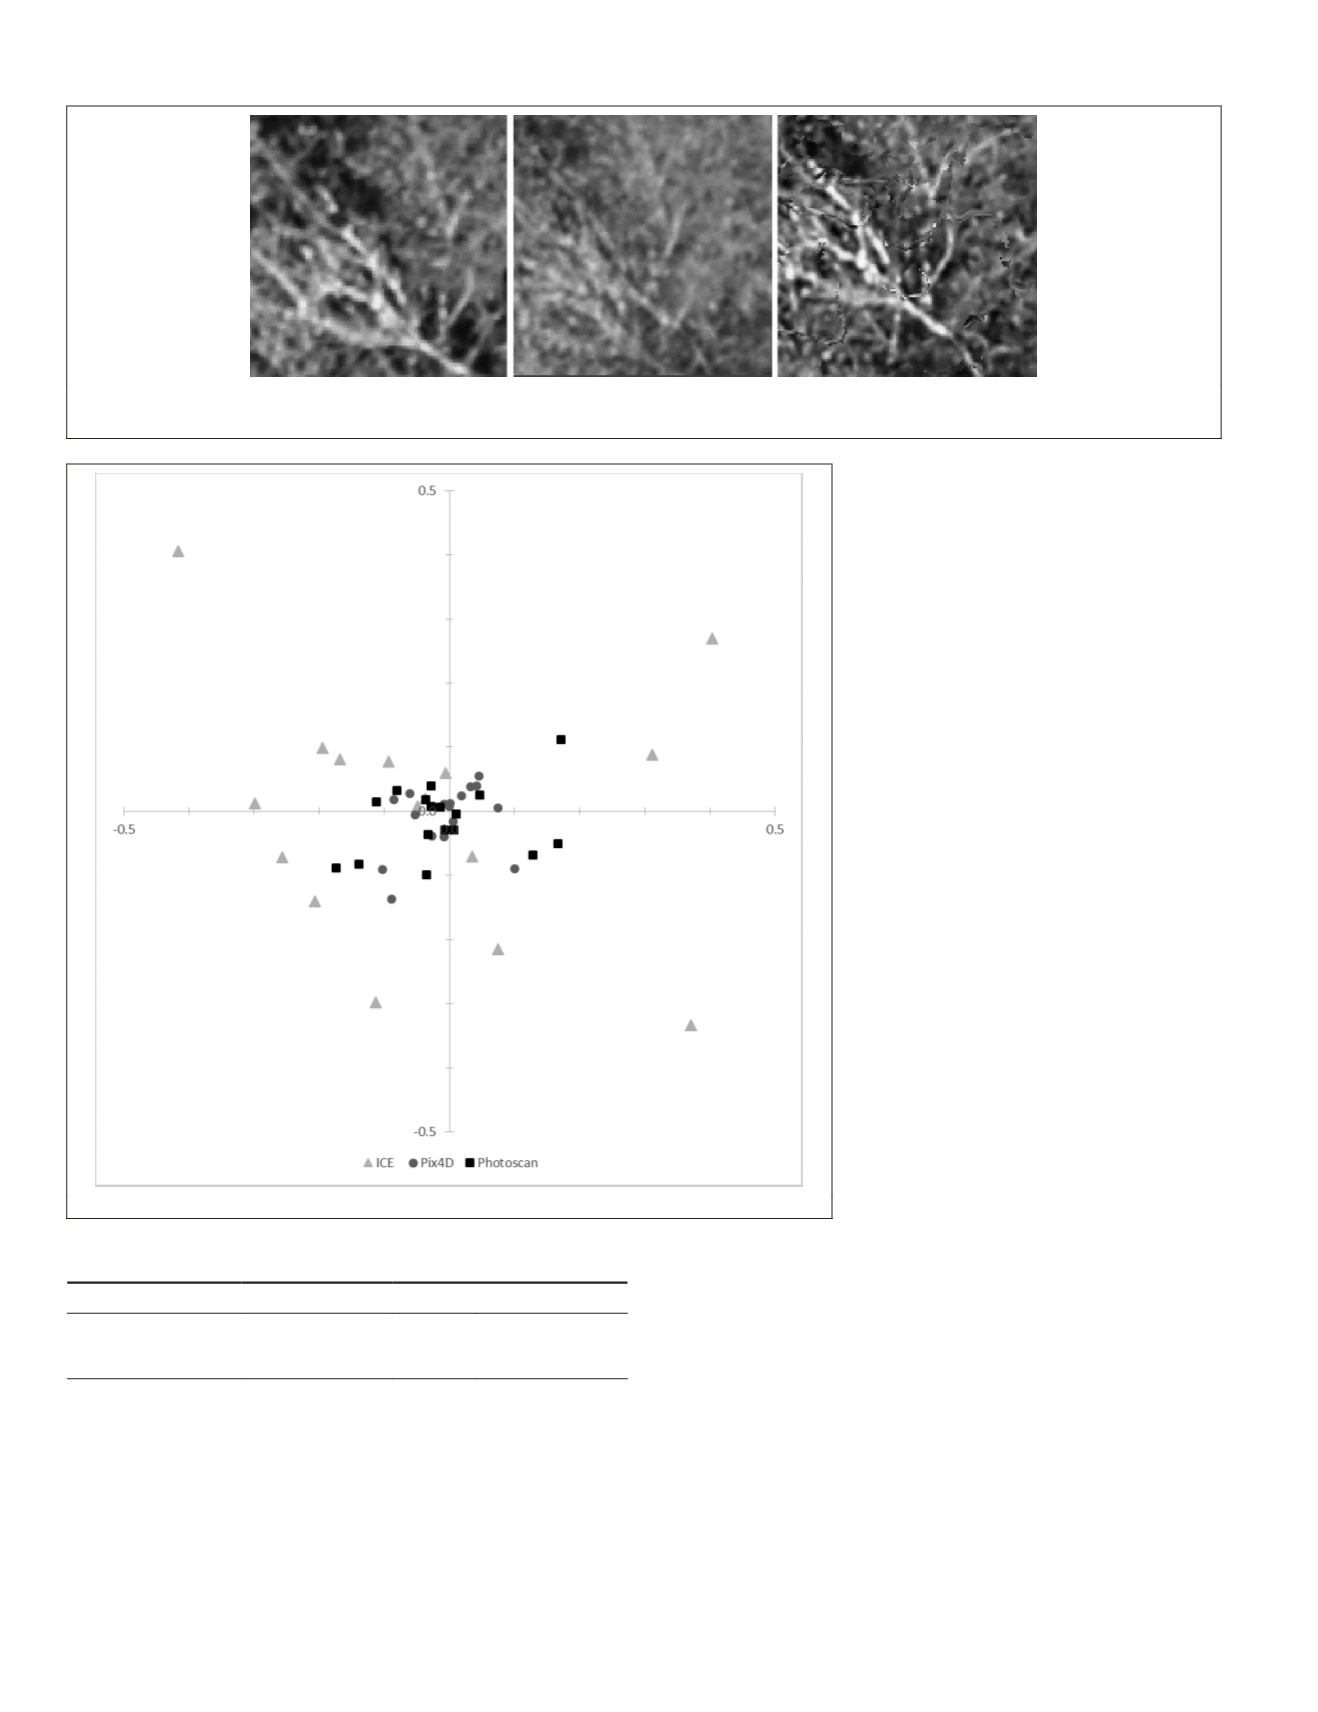
cm (Tukey test p >0.05) (Table 4). These
results are readily apparent when the
x
and
y
errors are viewed graphically, as
ICE
has a greater spread of errors in both the
x
and the
y
axis
compared to Pix4D and Photoscan Pro which are clustered
around the origin (Figure 3). Although they were not signifi-
cantly different, it should be noted that some of the increased
error of Photoscan Pro relative to Pix4D was likely due to the
increased presence of image artifacts which were present in
a number of the
GCP
s in Photoscan Pro (see the Visual Qual-
ity Section). Their presence made it more difficult to accu-
rately determine the geometric center of the
GCP
s leading to
decreased accuracy. It is also important to note that the goal
of this study was to look at the products exactly as they were
created. Photoscan Pro and Pix4D are Orthomosaics, and have
already taken into account (at least to some degree) terrain
relief. No such corrections were applied to
ICE
, which may
also help explain it increased geometric error.
Figure 2. A portion of the study area enlarged to show visual quality issues. The left image, taken from ICE is shown for comparison. The
image in the center, taken from pix4D, shows image blur. The right image, taken from Photoscan, shows image artifacts.
Figure 3. Geometric error in the
x
and
y
direction for the 17 validation points.
T
able
4. T
ukey
T
est
R
esults
for
G
eometric
A
ccuracy
A
ssessment
;
ANOVA
p
value
= 0.001; B
old
V
alues
I
ndicate
S
ignificance
Lower boundary Center Upper boundary
ICE vs Photoscan
-0.187
-0.108
-0.030
ICE vs Pix4D
-0.193
-0.114
-0.036
Pix4D vs Photoscan
-0.084
-0.006
0.072
422
June 2016
PHOTOGRAMMETRIC ENGINEERING & REMOTE SENSING


