The accuracies achieved by Photoscan Pro and Pix4D are
comparable to values reported in previous literature using
sUAS
imagery. For example a study conducted in 2010 by
Laliberte
et al
(2010) found
RMSE
values of 11.95 cm, 20.17
cm, and 16.69 cm for images collected over three study sites
in southwestern Idaho utilizing an in-house software. Turner
et al
., 2012 reported mean absolute total errors of 11.49 cm
and 24.71 cm for Photoscan Pro and Pix4D, respectively, for
imagery acquired over a lettuce farm in Australia. It should be
noted that the all geometric errors are less than typical uncer-
tainty from handheld differential
GPS
.
Visual Quality
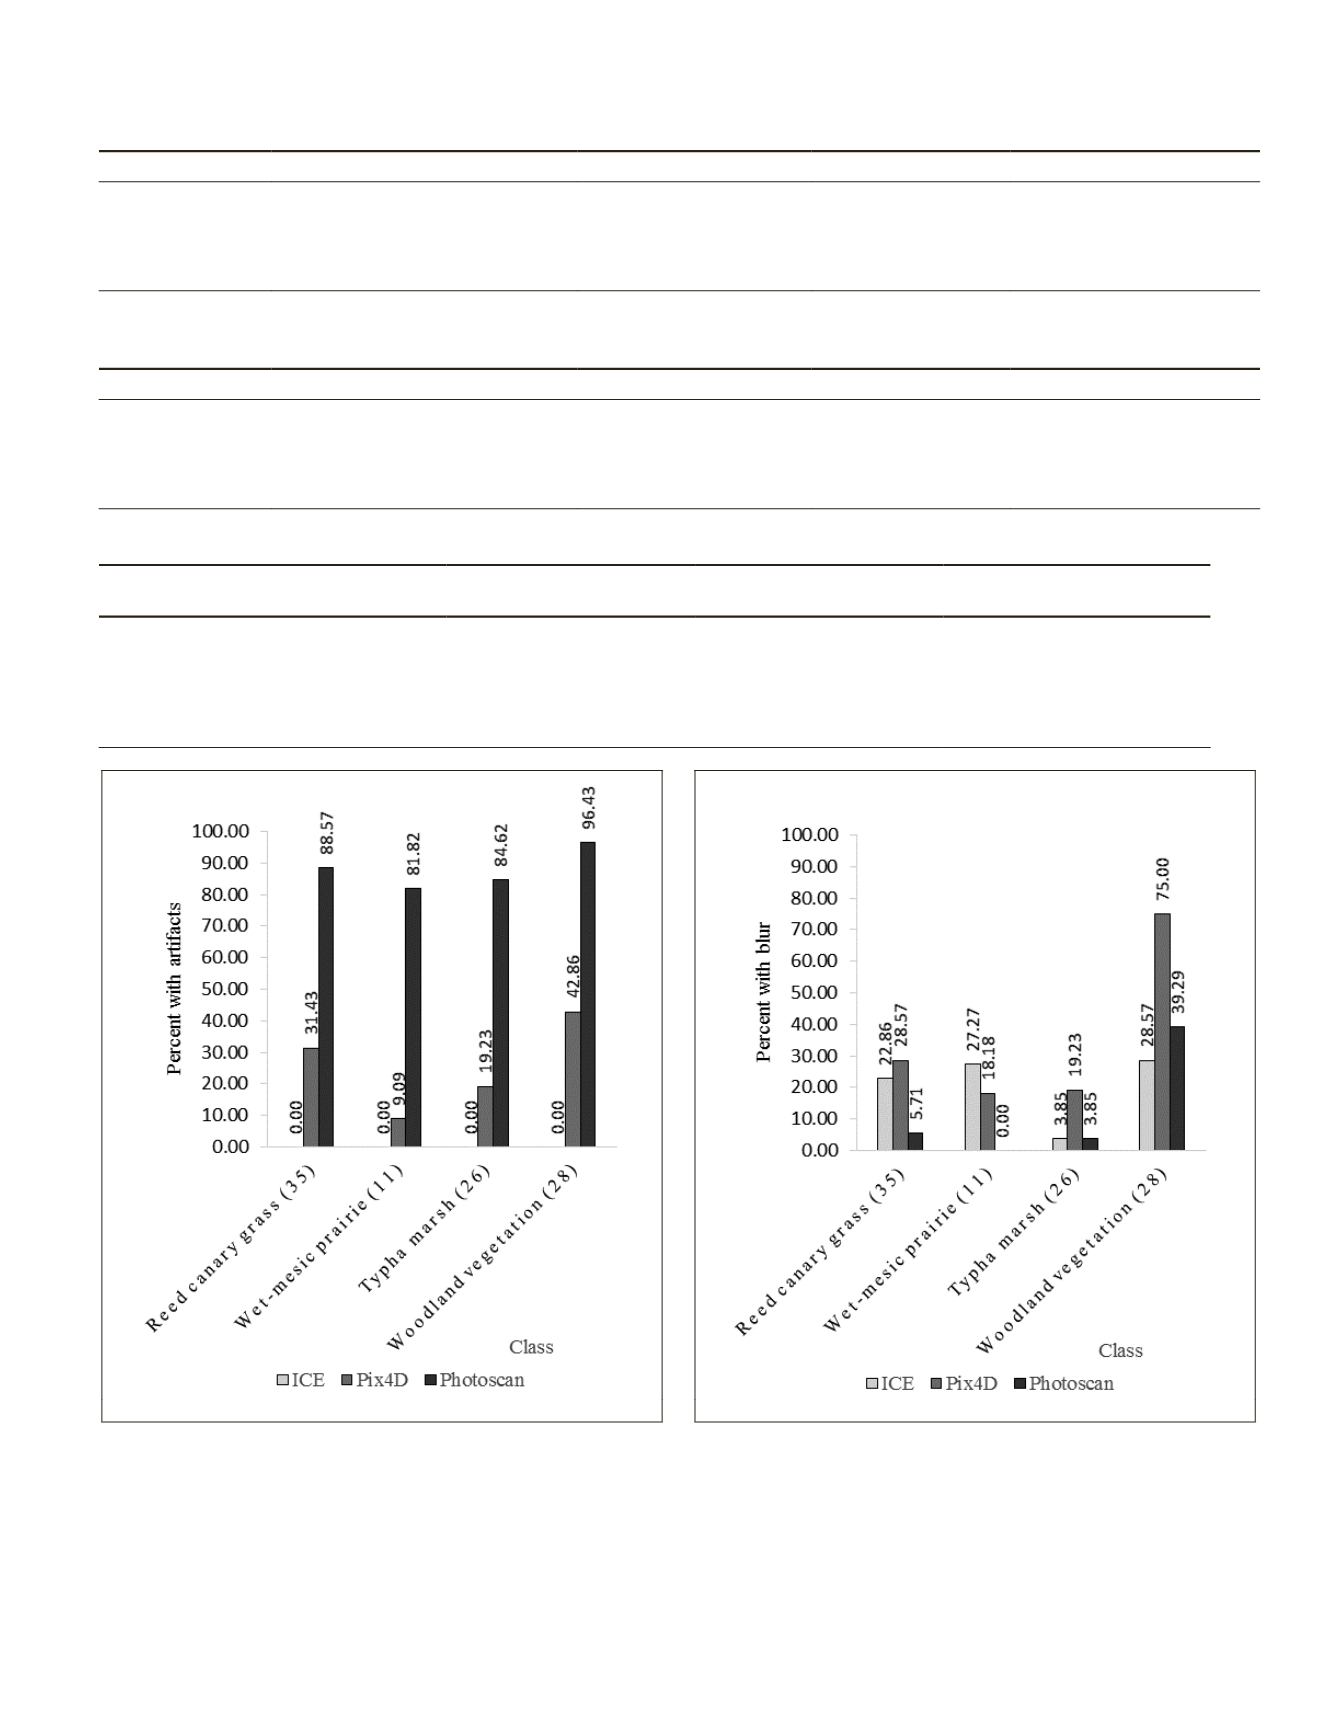
The results of this analysis are shown in Figures 4 and 5 and
Tables 5, 6, and 7. In terms of image artifacts, Photoscan Pro
Figure 5. Percent of each class with image blur.
Figure 4. Percent of each class with image artifacts.
T
able
5. P V
alues
for
E
ach
C
lass
in
T
erms
of
I
mage
A
rtifacts
C
ompared
between
the
T
hree
M
osaics
. V
alue
in
P
arenthesis
is
the
T
arget
p
V
alue
for
the
C
olumn
after
B
onferroni
C
orrections
B
old
V
alues
are
S
ignificant
. * I
ndicates
P
otential
F
alse
N
egative
.
Class
ICE vs Photoscan vsPix4D (p=0.050) ICE vs Photoscan (p=0.017) ICE vs Pix4D (p=0.017) Photoscan vs Pix4D (p=0.017)
Overall
< 0.001
< 0.001
< 0.001
< 0.001
Reed canary grass
< 0.001
< 0.001
< 0.001
< 0.001
Wet-mesic prairie
< 0.001
< 0.001
0.306
0.001
Typha marsh
< 0.001
< 0.001
0.019*
0.001
Woodland Vegetation
< 0.001
< 0.001
< 0.001
< 0.001
T
able
6. P V
alues
for
E
ach
C
lass
in
T
erms
of
I
mage
B
lur
C
ompared
between
the
T
hree
M
osaics
. V
alue
in
P
arenthesis
is
the
T
arget
p
V
alue
for
the
C
olumn
after
B
onferroni
C
orrections
; B
old
V
alues
are
S
ignificant
. NA R
epresents
C
omparisons
that were
not
C
alculated
because
O
verall
C
omparison was
not
S
ignificant
or
did
not
have
E
nough
D
ata
.
Class
ICE vs Photoscan vs Pix4D (p=0.050) ICE vs Photoscan (p=0.017) ICE vs Pix4D (p=0.017) Photoscan vs Pix4D (p=0.017)
Overall
< 0.001
0.259
0.005
< 0.001
Reed canary grass
0.040
0.040
0.585
0.011
Wet-mesic prairie
0.192
NA
NA
NA
Typha marsh
0.081
NA
NA
NA
Woodland Vegetation
0.001
0.397
0.001
0.007
T
able
7. P V
alues
for
E
ach
C
lass
C
omparison
in
T
erms
of
I
mage
B
lur
. B
old
V
alues
are
S
ignificant
. * I
ndicates
P
otential
F
alse
N
egative
. NA R
epresents
D
ata
that was
not
C
alculated
because
O
verall
C
omparison was
not
S
ignificant
.
Class
Overall
ICE
0.065
Pix4D
< 0.001
Photoscan
< 0.001
Canary reed grass vs Wet-mesic prairie
NA
0.399
1.000
Canary reed grass vs Typha marsh
NA
0.550
1.000
Canary reed grass vs Woodland vegetation
NA
< 0.001
0.001
Wet-mesic prairie vs Typha marsh
NA
1.000
1.000
Wet-mesic prairie vs Woodland vegetation
NA
0.003
0.017*
Typha marsh vs Woodland vegetation
NA
< 0.001
0.002
PHOTOGRAMMETRIC ENGINEERING & REMOTE SENSING
June 2016
423


