Other studies combined local maximum filtering and
binarization. Pouliot
et al
. (2002) took the absolute differ-
ence of the
NIR
and red bands in color infrared imagery (5 cm
pixel size) and thresholded trees using a local maximum filter
on the image with accuracies that ranged from 39.4 to 88.9
percent for detecting trees. Following earlier work by Carter
(1994), Bunting and Lucas (2006) applied red edge and red
band ratios and selected the maximum value in hyperspectral
imagery with a pixel size of 1 m and achieved an accuracy
of 19.2 to 91.6 percent in delineating tree crowns depend-
ing on the stem diameter at breast height. Wang
et al.
(2004)
performed a principal components analysis on a hyperspectral
image to create a single band and applied image maxima tech-
niques to extract forest cover with an accuracy of 75.6 percent.
Image scale issues influence accuracy of tree detection and
arise when trees are of different sizes, as small trees can be
missed. Pouliot and King (2005) used a local smoothing factor
and incremental Gaussian smoothing on color infrared digital
imagery to examine tree detection when trees were large
compared to the ground pixel size. They performed their test-
ing on imagery ranging from 5 to 15 cm pixels and found that
smaller pixel sizes brought the overall accuracy up to 96.4
percent from 58.5 percent depending on the tree cover and
smoothing algorithm.
Template matching is an object-based image processing
technique where parts of an image match a template. Quack-
enbush
et al
. (2000) developed templates by selecting typical
trees in 1.0 m digital imagery and applied those templates
to different areas in an image. User accuracies were between
86.5 and 94.8 percent depending on which template matching
technique they used.
Local maximum filtering, image binarization, scale analy-
sis, and template matching generally work best when the
spatial structure of the trees is relatively uniform (i.e., evenly
spaced and similarly aged) and consists primarily of bright
tree crowns and dark shaded gaps. Tree detection often de-
grades significantly when tree size and shape vary greatly (Ke
and Quackenbush, 2011).
In addition to spectral-based methods to identify trees, im-
age type and pixel size are relevant to image-based tree detec-
tion. If pixels are too small, tree trunks or branches and spacing
between rows of agriculture could become visible causing
problems with classifications. If pixels are too large, individual
trees are not discernible. Ke and Quackenbush (2011) reviewed
40 applications of tree crown detection and delineation re-
search and found that a ground surface distance (
GSD
) of 0.5
to 0.7 m was most commonly used. This was partially due to
the extensive use of Compact Airborne Spectrographic Imager,
an airborne sensor that has a
GSD
of 0.6 m, and also due to the
diameter of tree crowns, which were around a few meters in
diameter, allowing multiple pixels to fit within each crown so
that it becomes distinguishable (Ke and Quackenbush, 2011).
In summary, the methods described in the literature above
do not provide a reliable way to distinguish trees associated
with agricultural fields and pastures, residential and commer-
cial buildings, roads, parking lots, and wetlands using com-
mercial satellite imagery. This study’s objective is to develop
and test forest cover indices that can reliably distinguish for-
est cover from other land covers using WorldView-2 imagery,
which is coarser in spatial resolution than the imagery types
discussed in this section.
Materials and Methods
Study Site
The U.S. Department of Agriculture (
USDA
) Henry A. Wallace
Beltsville Agricultural Research Center (
BARC
) is near Belts-
ville, MD (39.025° N, 76.850° W) and includes >2500 hectares
of agricultural fields and pastures; conifer and deciduous
woodlands; wetlands; and some urban features, such as
buildings, roads, and parking lots. Surrounding the
BARC
are
additional urban features including residential and commer-
cial buildings and infrastructures (Figure 1). Typical soil has
a sandy-textured surface layer and a taxonomic classification
of coarse-loamy, siliceous, mesic Typic (or Aquic) Hapludults
(Soil Survey Staff, 2018). The climate is humid subtropical
with precipitation occurring throughout the year (Weath-
erbase, 2017). The study site is located in the coastal plain
and consists of fairly flat to gently sloping uplands.
Data
The Worldview-2 satellite hosts an 8-band multispectral sen-
sor that measures reflectance in the visible and near infrared
regions of the electromagnetic spectrum from 400 to 1,040 nm
with 1.85 m spatial resolution at nadir (Table 1). Although
WorldView-2 can collect images up to 40-degrees off-nadir
(eoPortal Directory, 2017), the images analyzed were acquired
between 11.5 and 31.5 degrees off-nadir. A total of 13 World-
View-2 images
acquired between
May 2012 and
May 2015 were
analyzed. Four
images were
selected that
represented each
season and the
major pheno-
logical changes in
vegetation during
a year. The spring
image was from
27 May 2012,
summer was from
05 August 2012,
fall was from 26
October 2014,
and winter was
from 18 January
2013.
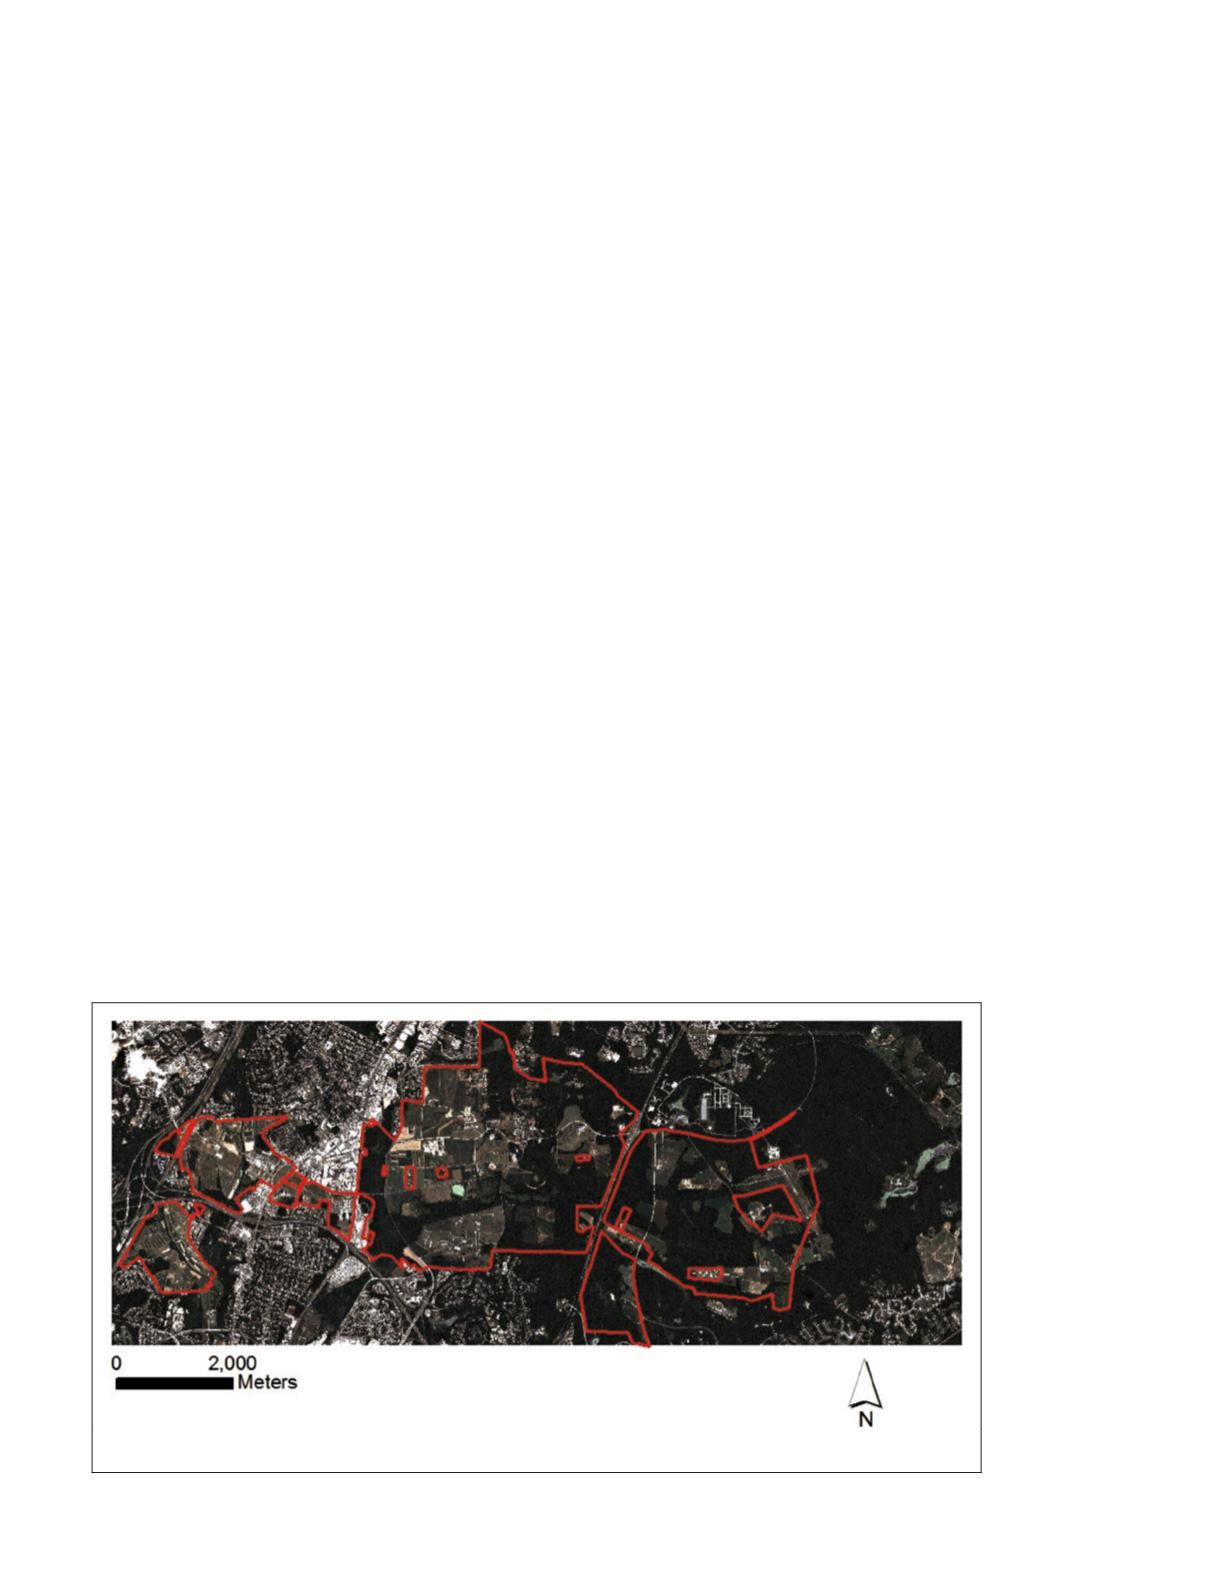
Figure 1. WorldView-2 image of Beltsville Agricultural Research Center (
BARC
) in Beltsville,
MD
from 05
August 2012. The
BARC
is outlined in red.
PHOTOGRAMMETRIC ENGINEERING & REMOTE SENSING
August 2018
507


