the phase angle measurements. The total tropospheric phase
change, which is the atmospheric phase angle error excluding
the ionospheric component, can be expressed as:
Φ
tropospheric
cos
ZDDD ZWDD
=
+
(
)
4
π
λ Θ
,
(6)
where
ZDDD
is the zenith dry delay difference, and
ZWDD
is the zenith wet delay difference.
Θ
is the incidence angle of
the
SAR
images.
Doin
et al
. (2009) summarized the effect of the error term
which consists of hydrostatic (dry) and wet components as
shown below.
Φ
tropospheric
zref
z
cos
k Rd
gm
P z Z zref
k
Rd
R
=
( )
−
(
)
(
)
−
−
−
∫
4 10 1
2
6
π
λ Θ
v
k
e
T
k
e
T
dz
1
3
2
+
(7)
Here,
θ
is the incidence angle,
Rd
is the specific gas con-
stant for dry air,
Rv
is the specific gas constant for water,
gm
is the gravitational acceleration (
g
) averaged over the tropo-
sphere,
P
(
z
) is the surface pressure,
e
is the water vapor pres-
sure in Pa, and
T
is the temperature in K.
However, in the case that spaceborne radiometers such as
Moderate Resolution Imaging Spectroradiometer
(
MODIS
) and
MERIS
are the main sources of water vapor measurement, it is
necessary to build a simplified model as it is not feasible to ob-
tain pressure and water vapor layer information. Consequently,
the zenith dry delay difference is replaced as follows:
ZDDD = ZDDm – ZDDs
(8)
ZDDD
= (2.2779 + 0.024)
Ps
f lat H
,
(
)
(9)
f
(
lat. H
) = 1 – 0.000266
cos
(2*
lat
) – 0.00028
H
(10)
Here,
ZDDm
is the zenith dry delay in the master (see Saas-
tamoninen, 1972 for a detailed model),
ZDDs
is the zenith dry
delay in the slave,
p
s
(Hpa) is the surface pressure,
lat
is the
latitude (deg) of the target area, and
H
(km) is the height.
On the other hand, the zenith wet delay difference can be
expressed as shown below:
ZWDD= ZWD
m
– ZWD
s
(11)
ZWD
=
cTPWV
=
c
IWV
w
ρ
(12)
Here,
ZWD
m
is the zenith wet delay in the master,
ZWD
s
is
the zenith wet delay in the slave,
ρ
w
is the density of water,
IWV
is the total amount of water vapor over an observation
point, and
c
is the conversion factor from the total perceptible
water vapor (
TPWV
) to
ZWD
. According to Bevis
et al
. (1994),
c can be considered close to 6.67, although there is a depen-
dence on temperature.
In this study we employed two data sources, the observa-
tion of ground weather and surface pressure from the nearest
station to be used in calculating the zenith dry delay differ-
ence, and the
MERIS
water vapor product, which has been
proven effective as a source of water vapor data. The extract-
ed
ZWDs
can be applied to interferograms in conjunction with
dry, so-called hydrostatic components.
Processing Results and Discussion
Time Series Analysis with Stamps
The time series analysis with
StaMPS
showed meaningful
surface deformation, as shown in Figure 2. The long-term de-
formation along steep topography can be identified. Although
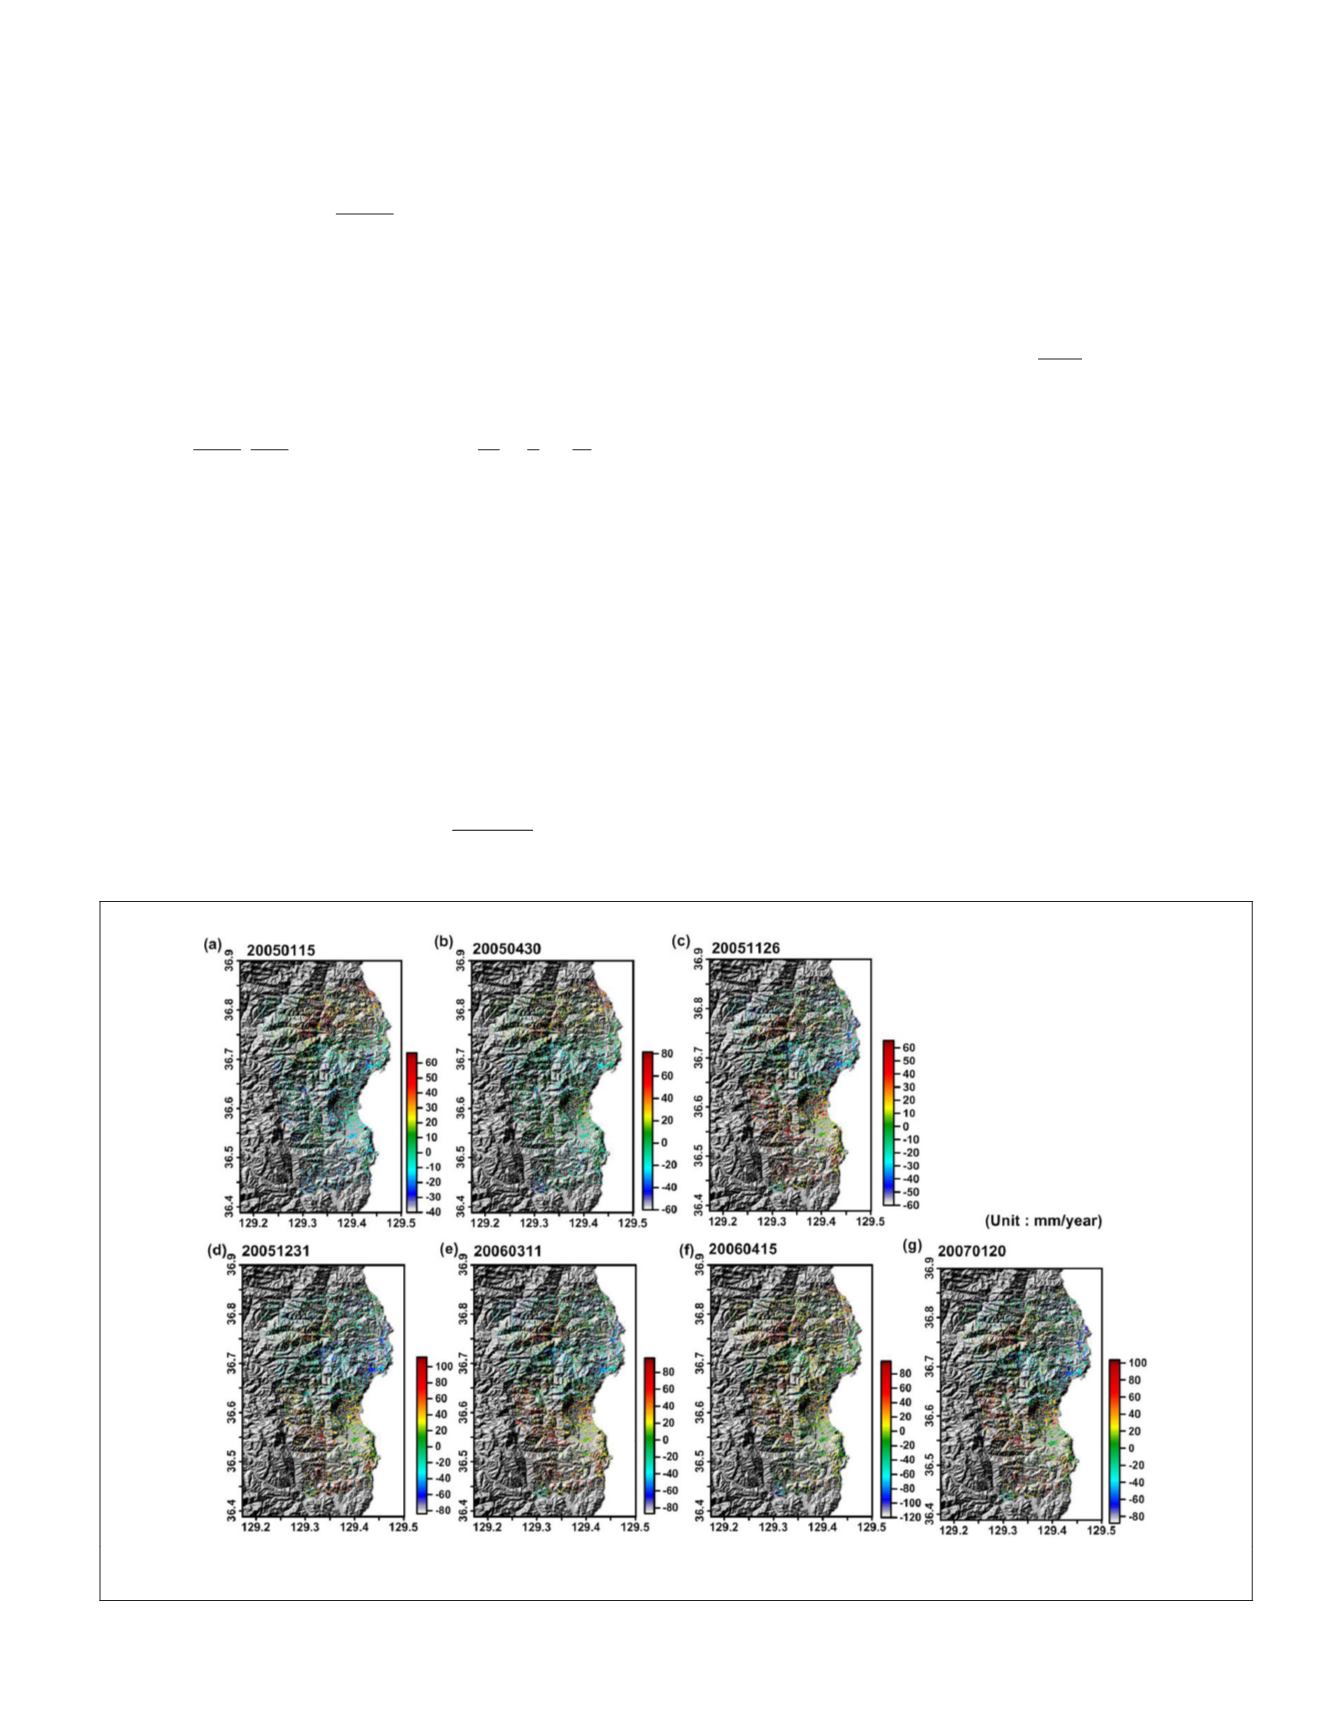
Figure 2. Deformation of time series by
StaMPS
during 24 July 2004 to 20 January 2007. Note the extracted deformations were
rescaled to the reference time 24 July 2004 which is the first image acquisition time of the
InSAR
time series.
PHOTOGRAMMETRIC ENGINEERING & REMOTE SENSING
April 2018
193


