where
Disp
slope
is the displacement along the slope,
Disp
LOS
is the displacement along the Line of Sight (
LOS
) and
θ
is the
angle between the
LOS
vector and slope direction. This way,
the deformation patterns of
InSAR
pairs become clear.
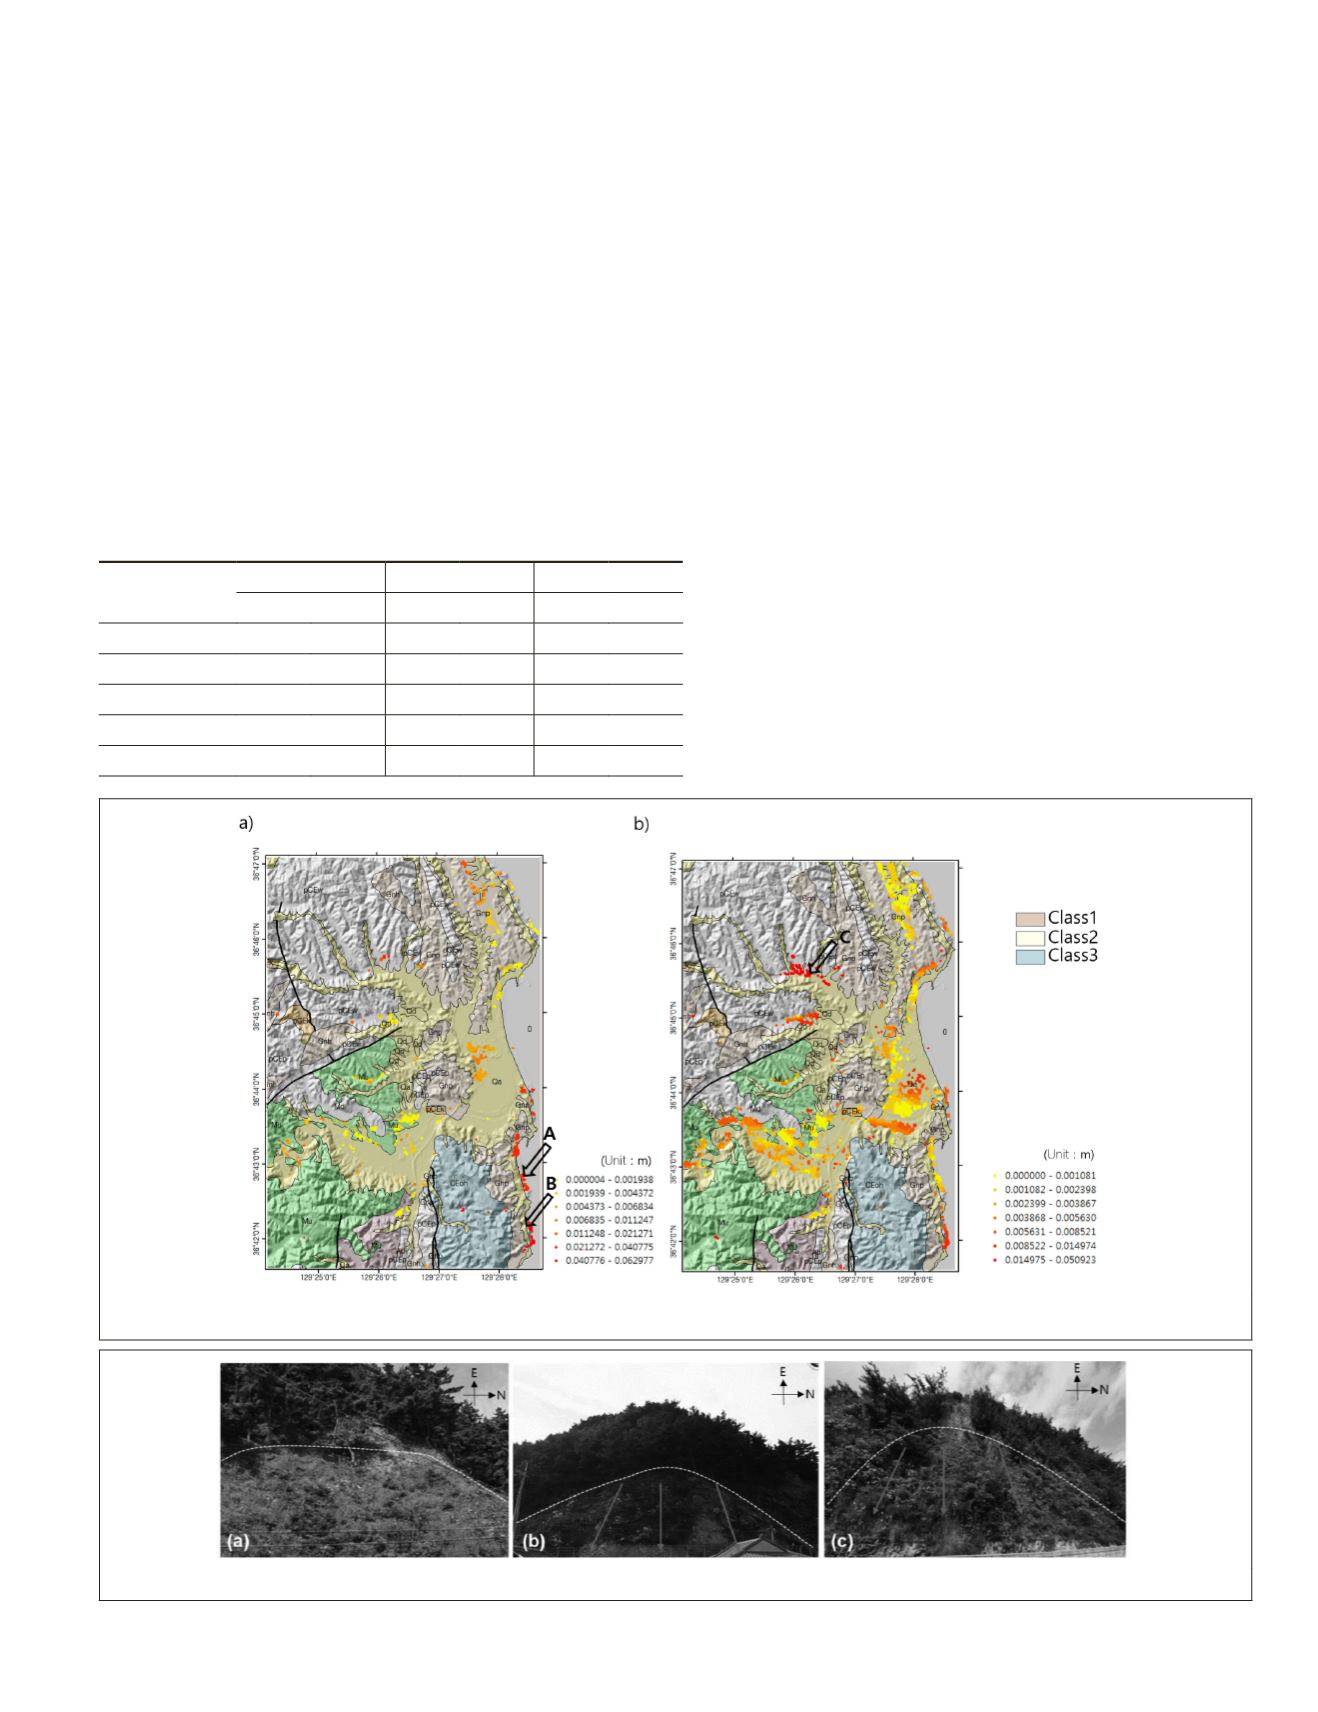
Areas prone to landslide occurrences are commonly
observed over the high-deformation parts of
DInSAR
analysis
along wall rock cuts (Figures 10 and 11). Considering the
acquisition times for pair 1, which covers the winter to spring
seasons, high deformation values over especially cutting
edges (Figure 10) can be explained as thawing and gradual
deconsolidation of surface material produces instabilities
along steep sides.
The relationship between
DInSAR
displacement and
landslide environmental factors (
LEFs
) of landslides was not
clearly revealed by a simple correlation check, as
LEFs
are
interrelated in complicated ways. To more clearly justify
DInSAR
displacement as an indicator of potential risk, we
conducted the analysis of potential
LEFs
by clustering target
geomorphology. We classified the target areas into three cat-
egories by characteristic topographic traits, including slope,
profile convexity, minimum curvature, and maximum cur-
vature, together with
NDVI
, by way of
k
-means unsupervised
classification. As Table 2 shows, categories II and III are more
susceptible to landslides, given their higher slope and lower
NDVIs. In each class, the mean of displacement was com-
pared to the slope and
NDVI
. From the outcomes, it became
clear the displacement of categories correlated with
NDVI
and
slope as landslide
EFs
. The displacements of pair 1 (15 Janu-
ary 2005 to 30 April 2005) are more correlated with
LEFs
than
those of pair 2 (26 November 2005 to 31 December 2005),
presumably due to thawing processes and physical weather-
ing in pair 1 during the corresponding period. It was also ob-
served that, in category III, the highest risk type was located
in the transition area between igneous and metamorphic rock
regions, as was earlier shown in local landslides in Korea
(Choi, 1998). The target area is shaped by a pre-Cambrian and
Cambrian metamorphic basement series and shows a num-
ber of primary granite intrusions that post-date the Mesozoic
sedimentary record resulting in a series of volcanic bodies
and associated paragneisses and Mesozoic metasediments
with a pronounced schistosity that is trending in a more or
less coastal-parallel
NNW-SSE
to
NNE-SSW
direction. Shallow
foliation surface angles of no more than 20 degrees in
NE
to
NW
direction and an exposition parallel to the main coast
provide the perfect settings for a pronounced susceptibility
to weathering effects as our analyses also confirm. Chemi-
cal weathering and breakdown of schist minerals is likely
directly caused by water intrusion, and physical weather-
ing controlled by seasonal coastal temperature effects likely
Figure 10. Project deformation maps along to the slope orientation: (a) between 15 January 2005 to 30 April 2005, (b) between
26 November 2005 to 31 December 2005, including locations of field observations shown in Figure 8.
Figure 11. Ground observations in high deformation areas: (a), (b), and (c). Locations of subfigures are shown in Figure 9.
Table 2. The topographic characteristics and
NDVI
in three
categories of the target area.
Category I
Category II
Category III
Mean Stddev Mean Stddev Mean Stddev
NDVI
0.249 0.06 0.196 0.083 0.1425 0.1037
Slope (deg)
1.220 1.119 5.398 1.245 9.539 0.681
Profile convexity -0.021 0.037 -0.068 0.060 -0.080 0.062
Min curvature -0.117 0.163 -0.305 0.200 -0.342 0.207
Max curvature 0.020 0.069 0.051 0.129 0.102 0.154
PHOTOGRAMMETRIC ENGINEERING & REMOTE SENSING
April 2018
199


