Since the deformation patterns along high-relief areas were
still not clearly identified, error effects within the base topog-
raphy were suspected as the source of major
DInSAR
errors and
were addressed consequently.
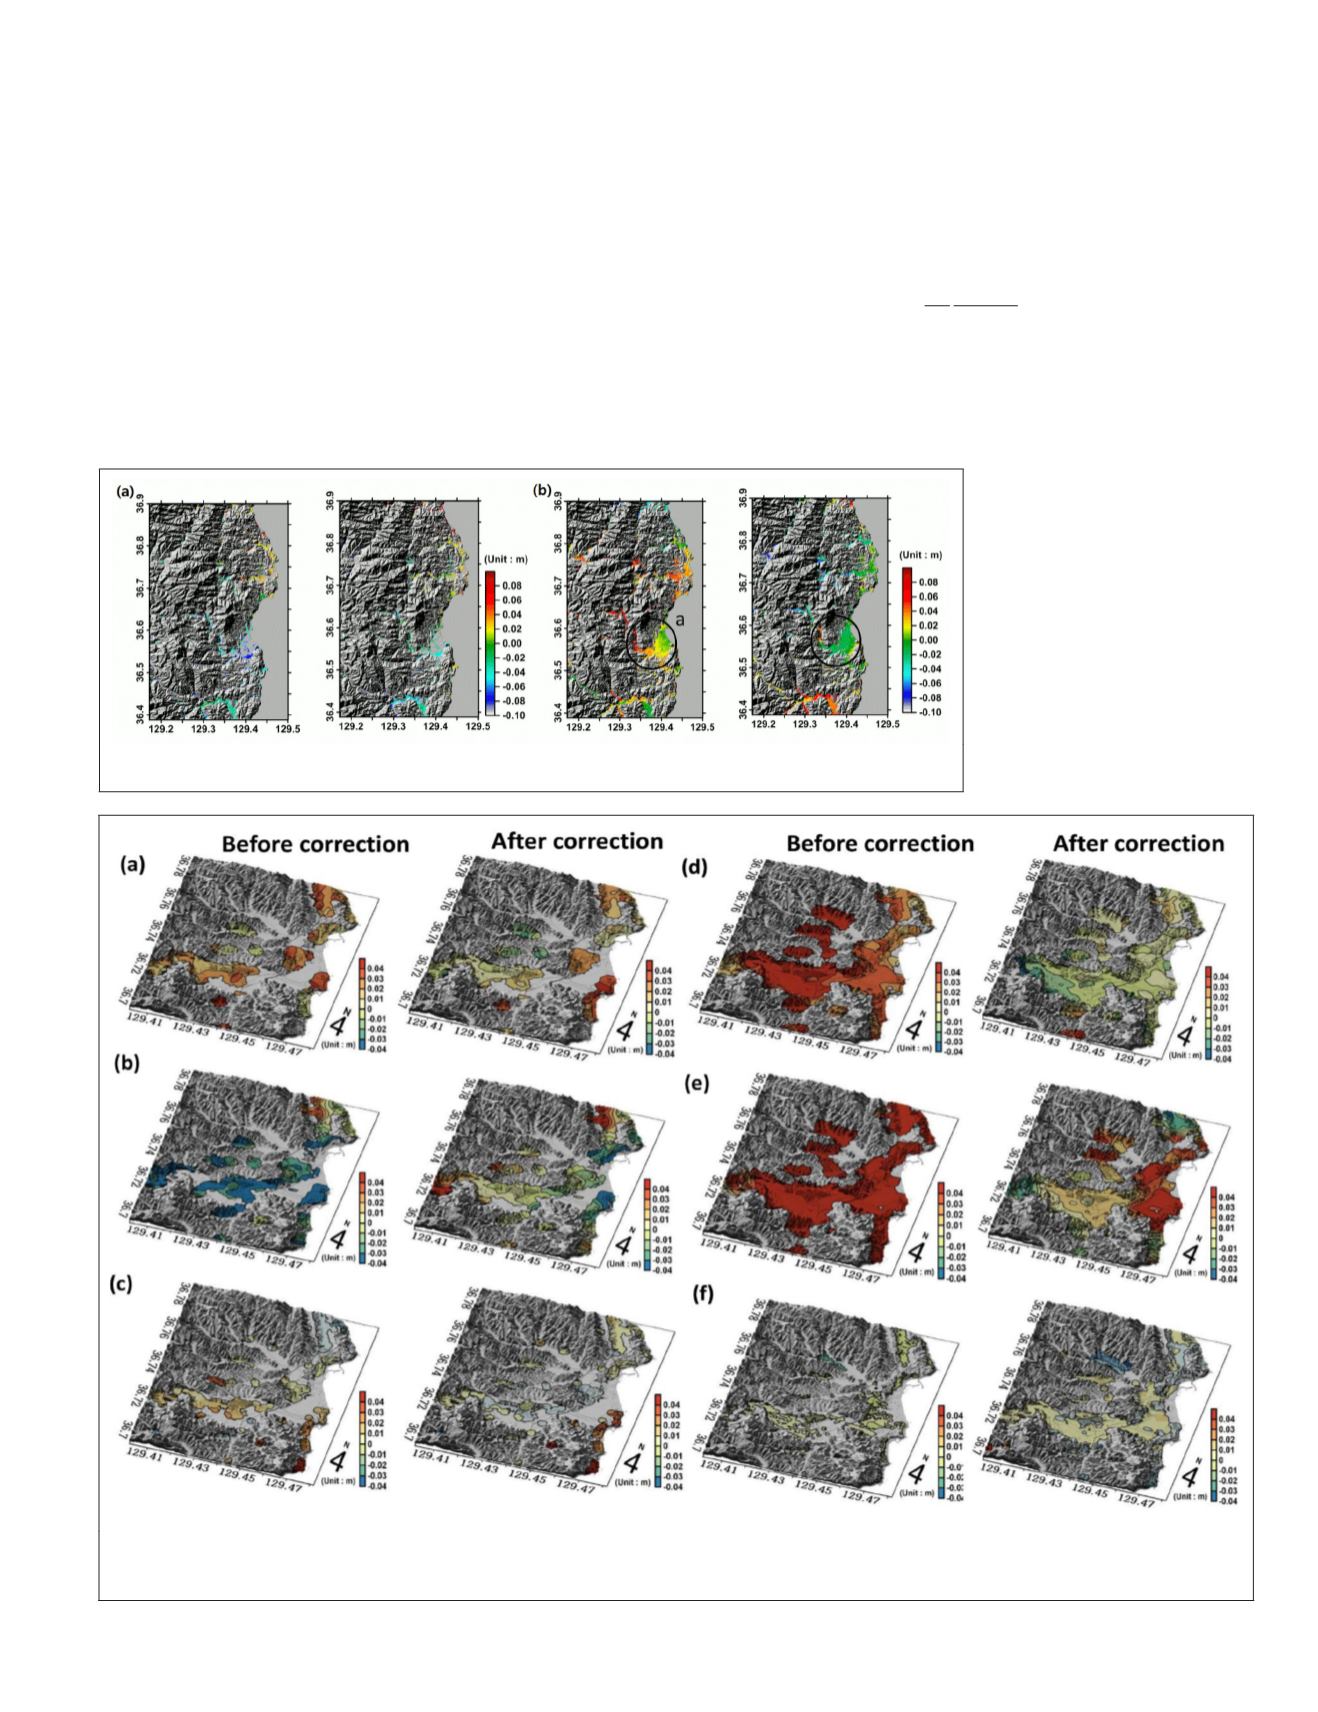
We attempted to evaluate the effect of base topography
with 90 m
SRTM DEM
, 30 m
ASTER DEM
, and finally a 2 m lidar
DEM
in combination with an atmospheric correction. The ef-
fects of changes in the base topography are shown in Figure 6.
In both pairs 1 and 2, high-deformation areas are located
in only small areas along steep wall rock cuts after employ-
ing an atmospheric correction. The final outcomes using a
lidar base
DEM
and atmospheric correction shown in Figure
6c and 6f demonstrate that landslide susceptible areas are
located mainly along wall rock cuts and occur during the
thawing season. It can also be shown that
DInSAR
analysis
using conventional
SRTM
and
ASTER DEM
can result in inaccu-
rate prediction of landslide locations even after employing an
atmospheric correction.
Thus we further analyzed and assessed the effects of error
components.
The deformation error by the height residual of the base
DEM
can be expressed as stated below:
Φ
t
p
error
B
rsin
z
=
( )
4
π
λ
θ
(13)
where
Ф
t
is the phase difference by the inaccurate base
topography,
λ
is the wavelength of the
SAR
sensor,
B
p
is the
perpendicular baseline,
θ
is the incidence angle,
r
is the range
between sensor and target and
z
error
is the base
DEM
error. It
has been proposed that the
effects of the base
DEM
error
is negligible compared to
the atmospheric error for the
estimation of deformation as
stated in Hanssen (2001). The
missing point regarding such
argument is that the accuracy
of the
DEMs
in a high-relief
and steep-sloped area where
landslides monitoring is
required were not reliable
due to potential horizontal
and vertical mis-registrations.
For example, an
SRTM DEM
which is usually employed
Figure 5.
DInSAR
results and correction with
ENVISAT ASAR
: (a) pair 1 (15 January 2005 to 30
April 2005), and (b) pair 2 (26 November 2005 to 31 December 2005)
Figure 6.
ENVISAT ASAR
pair 1 (15 January 2005 to 30 April) deformation maps with (a)
ASTER
base
DEM
, (b)
SRTM
base
DEM
, (c)
2m LiDAR base
DEM
and
ENVISAT ASAR
pair 2 (26 November 2005 to 31 December) deformation maps with (d)
ASTER
base
DEM
,
(e)
SRTM
base
DEM
, and (f) 2m lidar base
DEM
.
PHOTOGRAMMETRIC ENGINEERING & REMOTE SENSING
April 2018
195


