the time series analysis of
eight
InSAR
images over 2.5
years is not sufficient to
catch the seasonally-inten-
sified deformation caused
by heavy precipitation and
thawing, a useful inference
from this analysis is that
the deformation range in
the target area was within a
maximum of 2 to 3 cm near
steep sides. Therefore,
StaMPS
deformations corresponding
to two pass
DInSAR
observa-
tions were reconstructed,
as demonstrated in Figure
3. Since the total number of
scatterers by
StaMPS
corre-
sponding to the two-pass
DIn-
SAR
observation area are only
highly limited (<40 points
over the areas shown in Figure 3), a direct
inter-comparison with the two-pass
DInSAR
result was not feasible. The results of
StaMPS
proved the
DInSAR
time series analy-
sis was not suitable to observe the surface
deformation of rockwall cuts which are the
target of interest in our landslide observa-
tions.
Two Pass DInSAR Analyses and Error Analyses
Ground weather information, including
surface pressure and temperature used
to calculate the difference in zenith dry
delay was taken from observations at the
572 stations of the Korean Meteorological
Administration’s observation network. As
a source of water vapor data, the
MERIS
wa-
ter vapor product was used to interpolate
a high-quality water vapor grid. However,
frequent cloud coverage over mountainous
regions in the mid-latitude of the target
areas was a crucial drawback. Fortunately,
MERIS
Reduced Resolution (
RR
) coverage
over these areas (Figure 4) included cloud-
free scenes in
SAR
acquisition times (15
January 2005 to 30 April 2005 and 26 No-
vember 2005 to 31 December 2005), so that
the water vapor map constructions were
feasible with spatial resolutions of 1.2 km
in two
DInSAR
pairs. It was proposed that
the densities of water vapor data from
MERIS
were sufficient to compensate for the
phase delay error due to the orographic
effect, which represents a pattern similar
to the global topography of the target areas.
In response, time series analyses such as
SBAS
and
PS
were developed. Despite insuf-
ficient numbers of
InSAR
pairs used for time
series analysis,
StaMPS
processing results
showed similar deformation patterns with outputs from cor-
rected two-pass
DInSAR
(Figures 3 and Figure 5), especially
over seashore road cuts.
The effects of atmospheric error suppressions are dem-
onstrated in Figure 5, especially in area “a” of pair 2. Areas
showing significant deformation values were corrected by the
atmospheric correction and turned out to be stable surfaces.
Since neither natural deformations nor artificial construc-
tions were reported in these areas, it is clear that those
deformations were caused by the artifacts in the phase delay
and were corrected successfully by the constructed phase-de-
lay map. Also, a similar deformation pattern between partial
StaMPS
results (Figure 3) and the corrected two pass
DInSAR
(Figure 5) should be noted. For the winter season, results
using both methods do not show any significant deformation
(Figure 3b and Figure 5b). This is in contrast to the weakly
identified deformation patterns in Figure 3a and Figure 5a
alongside a cutting edge over the seashore during thawing
seasons.
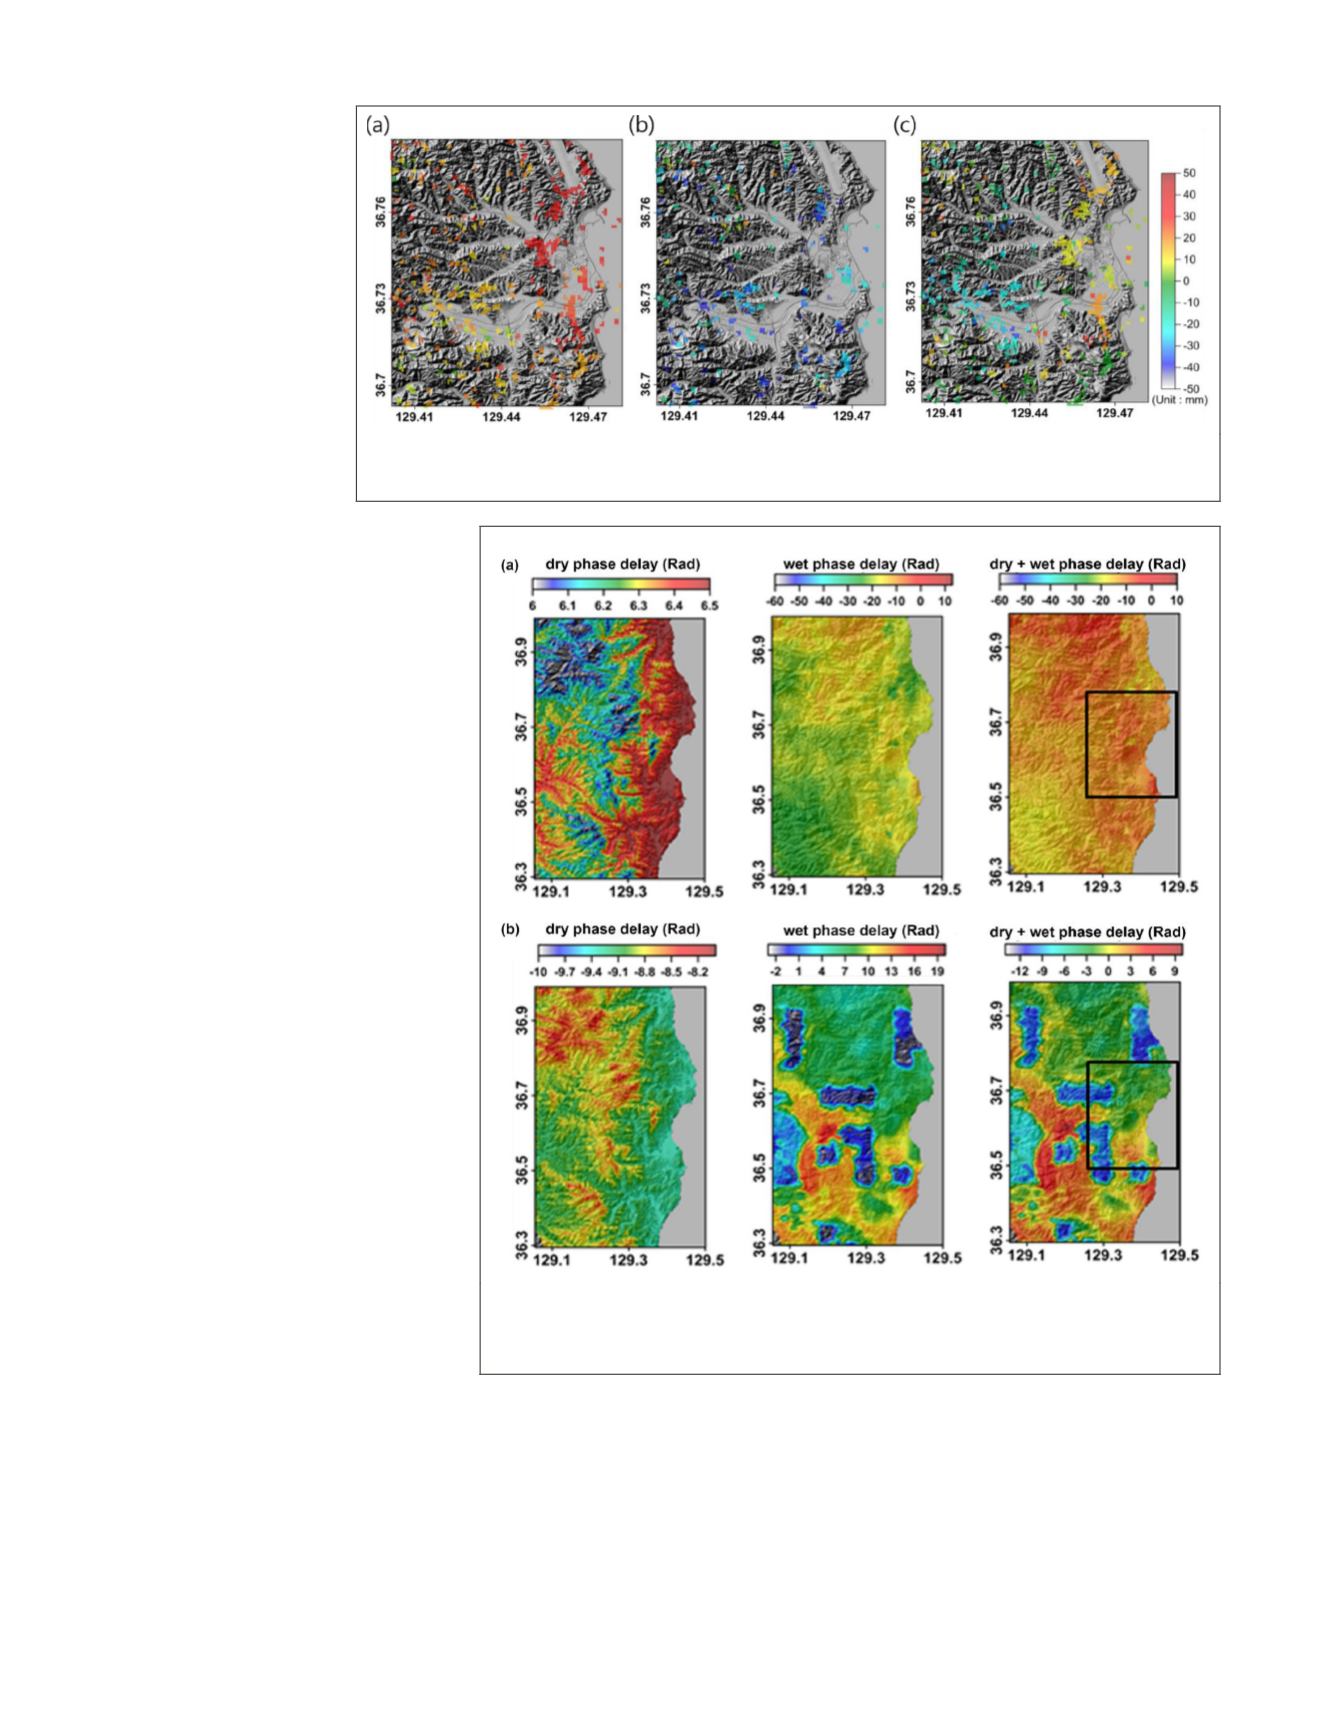
Figure 3. Subset deformation maps using
StaMPS
: (a) between 15 January 2005 to 30 April
2005, (b) between 26 November 2005 to 31 December 2005, and (c) mean deformation during
24 July 2004 to 20 January 2007.
Figure 4. Phase delay component maps (left: wet, center: hydrostatic, right:
total) for (a)
DInSAR
pair1 (15 January 2005 to 30 April 2005). and (b) pair 2
(26 November 2005 to 31 December 2005). Boxed area is the target site for the
atmospheric and base
DEM
correction.
194
April 2018
PHOTOGRAMMETRIC ENGINEERING & REMOTE SENSING


