for
DInSAR
analysis, showed large verti-
cal errors due to the horizontal shift over
high-relief areas (Kim
et al
., 2017). The
same problem might also exist over
ASTER
GDEM
or any other medium resolution
public domain
DEM
. Thus, it seems highly
obvious that the high-sloped topography
might induce higher and continuous
DEM
errors mainly caused by the horizontal
shift of geodetic control. We concluded
that
DEM
error terms cannot be easily ig-
nored for our purposes, as the high-slope
topography is more likely a landslide-
susceptible area and even few centimeters
of deformation screened by base
DEM
error can be highly crucial as a prelude
of landslide events. Moreover, such base
DEM
errors were frequently mixed with
atmospheric phase errors and produced
completely different deformation patterns
after passing phase-unwrapping proce-
dures during
DInSAR
processing.
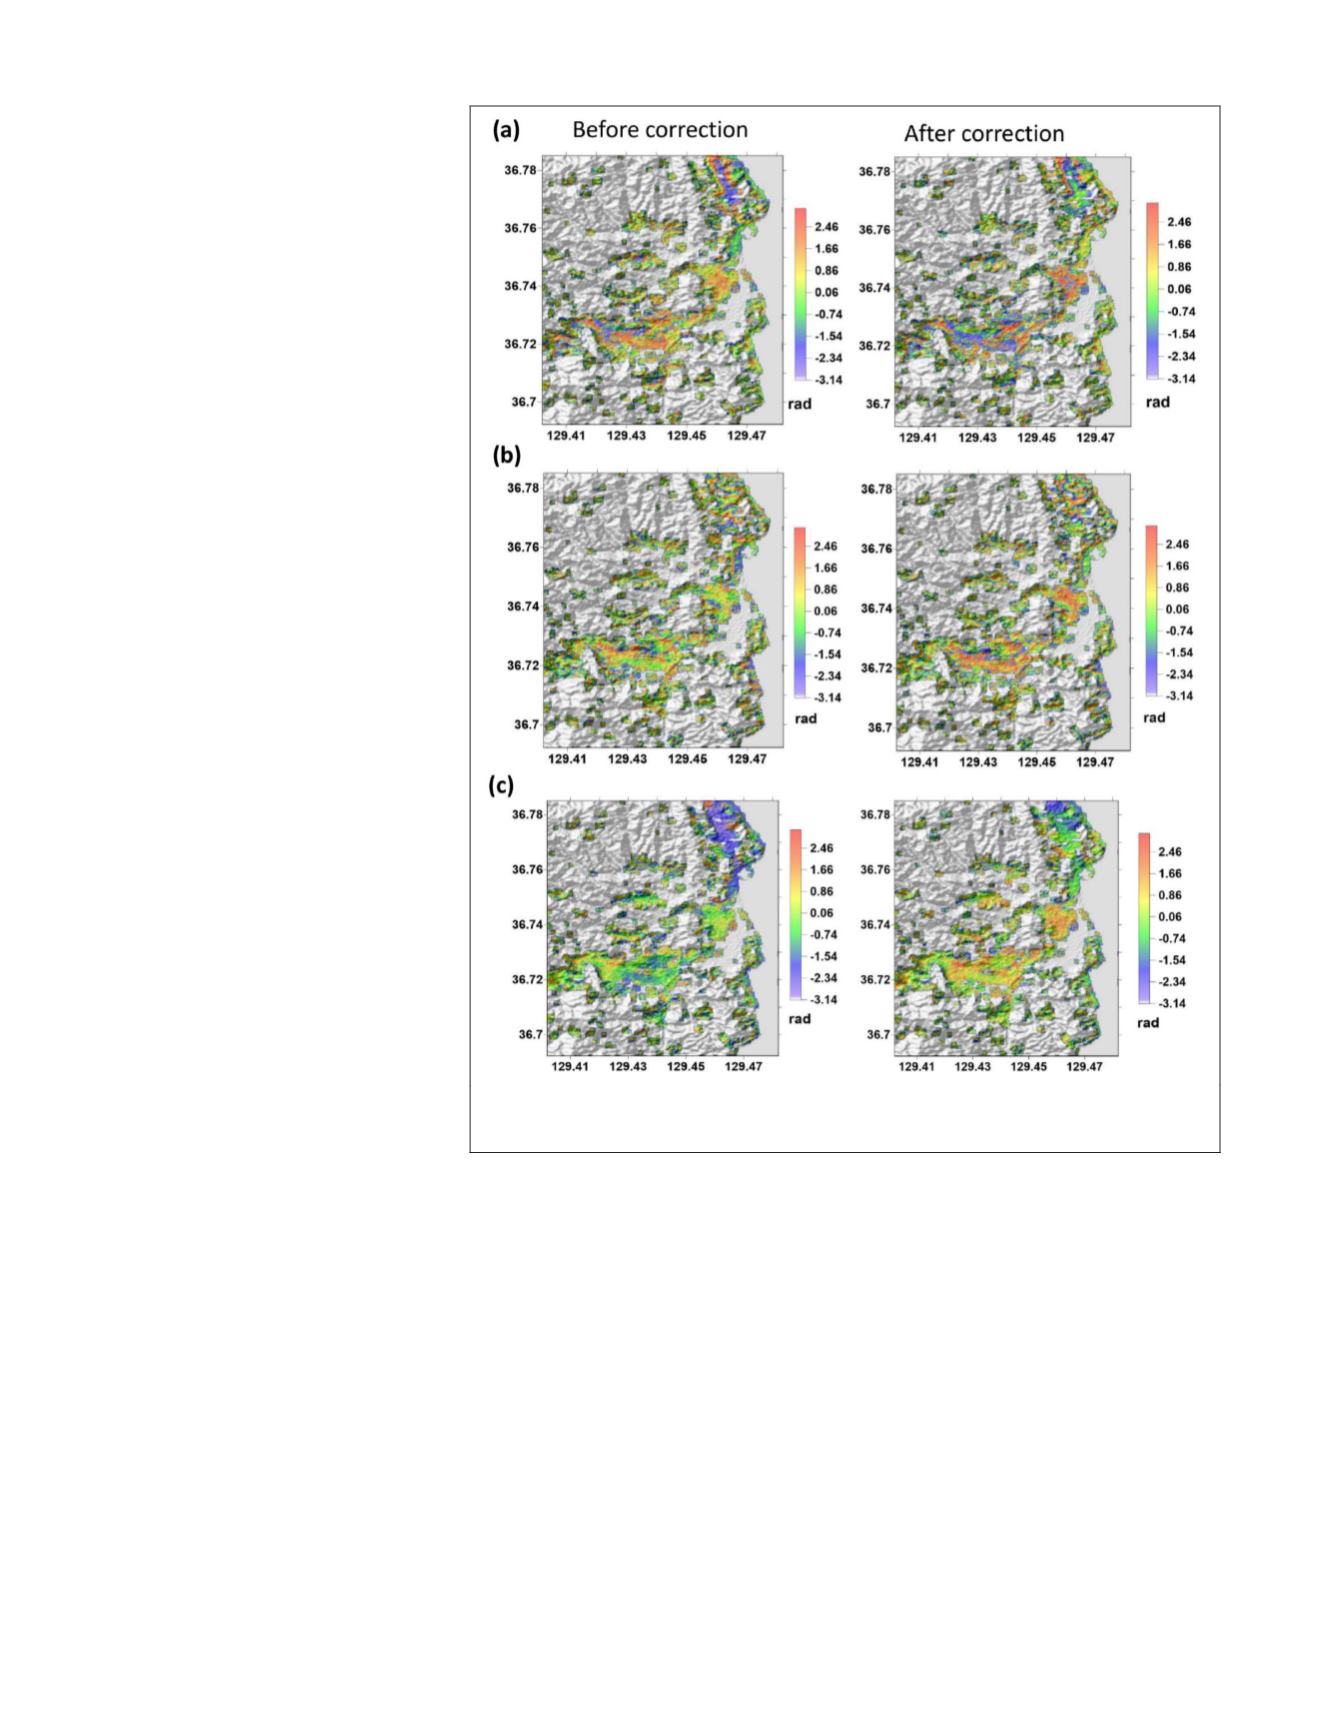
The effects of error corrections pro-
cedures using
APS
and high accuracy
base
DEMs
were not clearly revealed with
the migration of phase angle patterns as
shown in Figure 7. Thus, we employed
radon transformation to demonstrate
anisotropic spatial distributions of error
signals as conducted in Hanssen (1998)
and Li
et al
. (2007). Figure 8 represented
the phase signal migration in the radon
transformation with/without atmospheric
error corrections and three base
DEMs
.
We considered the radon transformation
with lidar base
DEM
and atmospheric cor-
rection in Figure 8f as a kind of pseudo
ground truth. It means that the radon
transformation of phase angles created
by the lidar-based
DEM
and atmospheric
corrections are very close to the error-free
phase-angle distribution. When compared
to Figure 8e which was created with a
lidar
DEM
but without atmospheric cor-
rection, a cluster with negative values
covering 0 to 360 degree angles and −100
to 125 pixel range in Figure 8f is the
phase angle component by target topogra-
phy, probably corresponding to corrected
deformation between Figure 6a and 6b.
By the same comparison, the distribution concentrated on the
50 to 360 degree range and −100 and 50 pixel range in Figure
8f might represent the main phase angle component revealed
after the atmospheric corrections corresponding to deforma-
tion changes as seen in Figure 6b and 6c. The atmospheric
error correction with the
SRTM
-based
DEM
produces somewhat
valid phase angle distribution as shown in Figure 8d but the
phase angle distribution by target topography is missing when
compared to 8f. The
InSAR
processing with the
ASTER
-based
DEM
completely mislead the phase angle distribution before
and after atmospheric corrections as shown in Figure 8a and
8b; thus it resulted in a completely wrong deformation pat-
terns as shown in Figure 6a and 6d. It should be noted that
we also found a similar patterns of error signal migration in
pair 2 cases. Therefore, we concluded that the atmospheric
correction together with a poor quality base
DEM
does not pro-
duce correct
DInSAR
deformation patterns to monitor preludes
of landslides. A high-quality base
DEM
such as lidar together
with a proper atmospheric error correction were considered
essential for the monitoring of potential landslide in highly
localized areas and involved with small surface migrations.
The target area and time domain by our
DInSAR
analyses
do not include any valid ground truth to prove processing
accuracy. Instead, we tried to check the accuracy of our
InSAR
processing employing the height residal between lidar and
other base
DEMs
, i.e.,
ASTER
and
SRTM
.
Figure 9 represents the outcome. Note that the estimated
deformation error line was calculated and the
DEM
error range
up to 40 m. For the calculation of observed deformation errors,
we first segmented connected deformations and calculated
the average height residuals and standard deviations within a
segment to avoid other possible error components induced by
DInSAR
processing stages such as registration or phase unwrap-
ping. Then, the observed deformation errors were calculated
using average height residuals and Equation 13.
First of all, in both cases before and after atmospheric
corrections, the deformation using the
ASTER
-based
DEM
Figure 7. Fringe patterns of pair 1 using (a)
ASTER DEM
; (b)
SRTM DEM
, and (c) lidar
DEM
. Note that the left parts are before atmospheric correction cases and the right part
are after atmospheric correction cases with pair 1 (15 January 2005 to 30 April 2005).
196
April 2018
PHOTOGRAMMETRIC ENGINEERING & REMOTE SENSING


