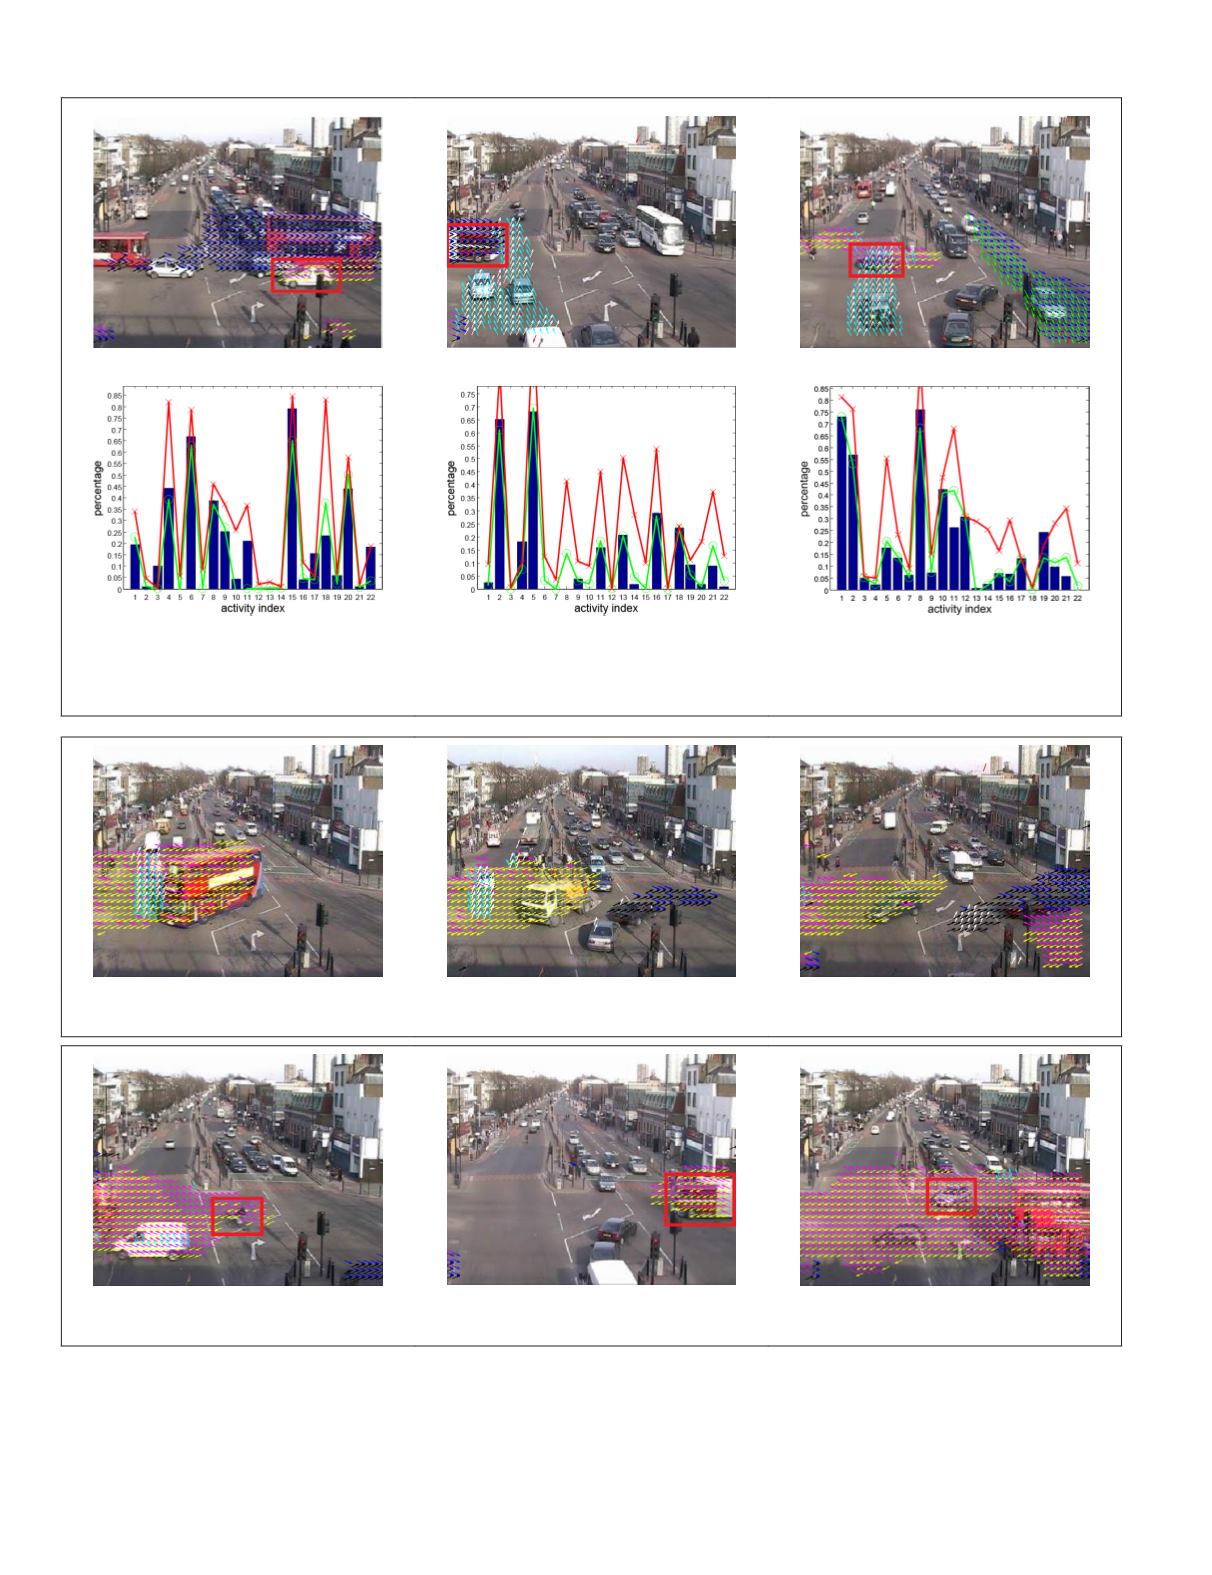
In Figure 11 the first row shows three examples of detected
abnormal events caused by conflicting activities. The second
row illustrates the observed values (blue bars) of each activity
in given scene, respectively. The green curves (circles) note
the mean predicted values
m
and the red curves (crosses)
equal
m
+1.96
σ
, i.e. the upper bounds of 97.5 percent confi-
dence region.
Normally, abnormal events are caused by conflicting
activities like jaywalking, illegal U-turn converse driving, or
aggressively cutting in other roads. We illustrate an example
for each type of such conflicting activities in Figure 12 The
(a)
(b)
(c)
(d)
(e)
(f)
Figure 12. The first row shows three examples of detected abnormal events caused by conflicting activities. The second row
illustrate the observed values (blue bars) of each activity in given scene, respectively. The green curves (circles) note the
mean predicted values m and the red curves (crosses) equal m +1:96, i.e. the upper bounds of 97:5 percent confidence region.
(a)
(b)
(c)
Figure 13. Falsely detected abnormal events by the
GP
regression models.
(a)
(b)
(c)
Figure 14. Examples of missing detected abnormal events.
212
April 2018
PHOTOGRAMMETRIC ENGINEERING & REMOTE SENSING


