urban study, particularly for urban-
ization monitoring, with the aim to
identify and classify the land use
type (Rodrigues
et al
., 2012). Jiang
et al
. (2015) utilized volunteered
POI
data to estimate the land use at
census block level. Hu
et al
. (2016)
integrated Landsat imagery and
open social data to map the urban
land use of Beijing, China.
Open-
StreetMap
4
(
OSM
) is a collaborative
mapping project where maps are
collected and upload by volunteers.
As the pioneer project of Volun-
teered Geographic Information,
OSM
has provided a large volume of
fully open-source and editable geo-
graphical data including roads, wa-
terways, railways, and buildings.
Currently,
OSM
data have become a
popular data source and have been
widely used in urban issue, such
as the research in Arsanjani
et al
.,
2013 and Johnson and Iizuka, 2016.
These studies, although limited,
suggest a strong potential to inte-
grate the remote sensed features
with social knowledge.
Remote sensing is an effective
technology to map the ground with
large coverage, but the latest and high-resolution remote sens-
ing imagery is not easy to access. On the other hand, social
data, with the attributes of geographic and human activity
characteristics, constitute an interesting source of informa-
tion. In this paper, a new technique for the estimation of
IS
,
taking advantage of both remote sensing data and social data,
is developed. Morphological attribute profiles (
MAPs
) (Dalla
Mura
et al
., 2010) is an advanced tool for spatial features ex-
traction from remote sensing imagery, while spectral mixture
analysis (
SMA
)-based methods are effective to evaluate the
characterization of
IS
. In this work, we adopt
MAPs
of four
structural attributes (area, length of bounding box, standard
deviation, and moment of inertia) into a
SMA
model to gener-
ate physical features from multi-spectral remote sensing
imagery. On the other hand, we apply a normalized kernel
density estimation (
KDE
) model (Silverman, 1986) to estimate
the social features of
IS
using
POI
datasets. To further enhance
the urban structure information, road network datasets are
considered in our experiments. Finally, we use a multivari-
able linear regression model (
LRM
) for feature integration in
two different level, i.e. pixel level and parcel level.
The reminder of this paper is structured as follows. The
next Section 2 introduces the study area and the datasets
adopted in our experimentsfollowed by our methodological
approach in detail. The experimental results and discussions
are then demonstrated. Finally, we conclude the paper with
some remarks and hints at plausible future research
Study Area and Datasets
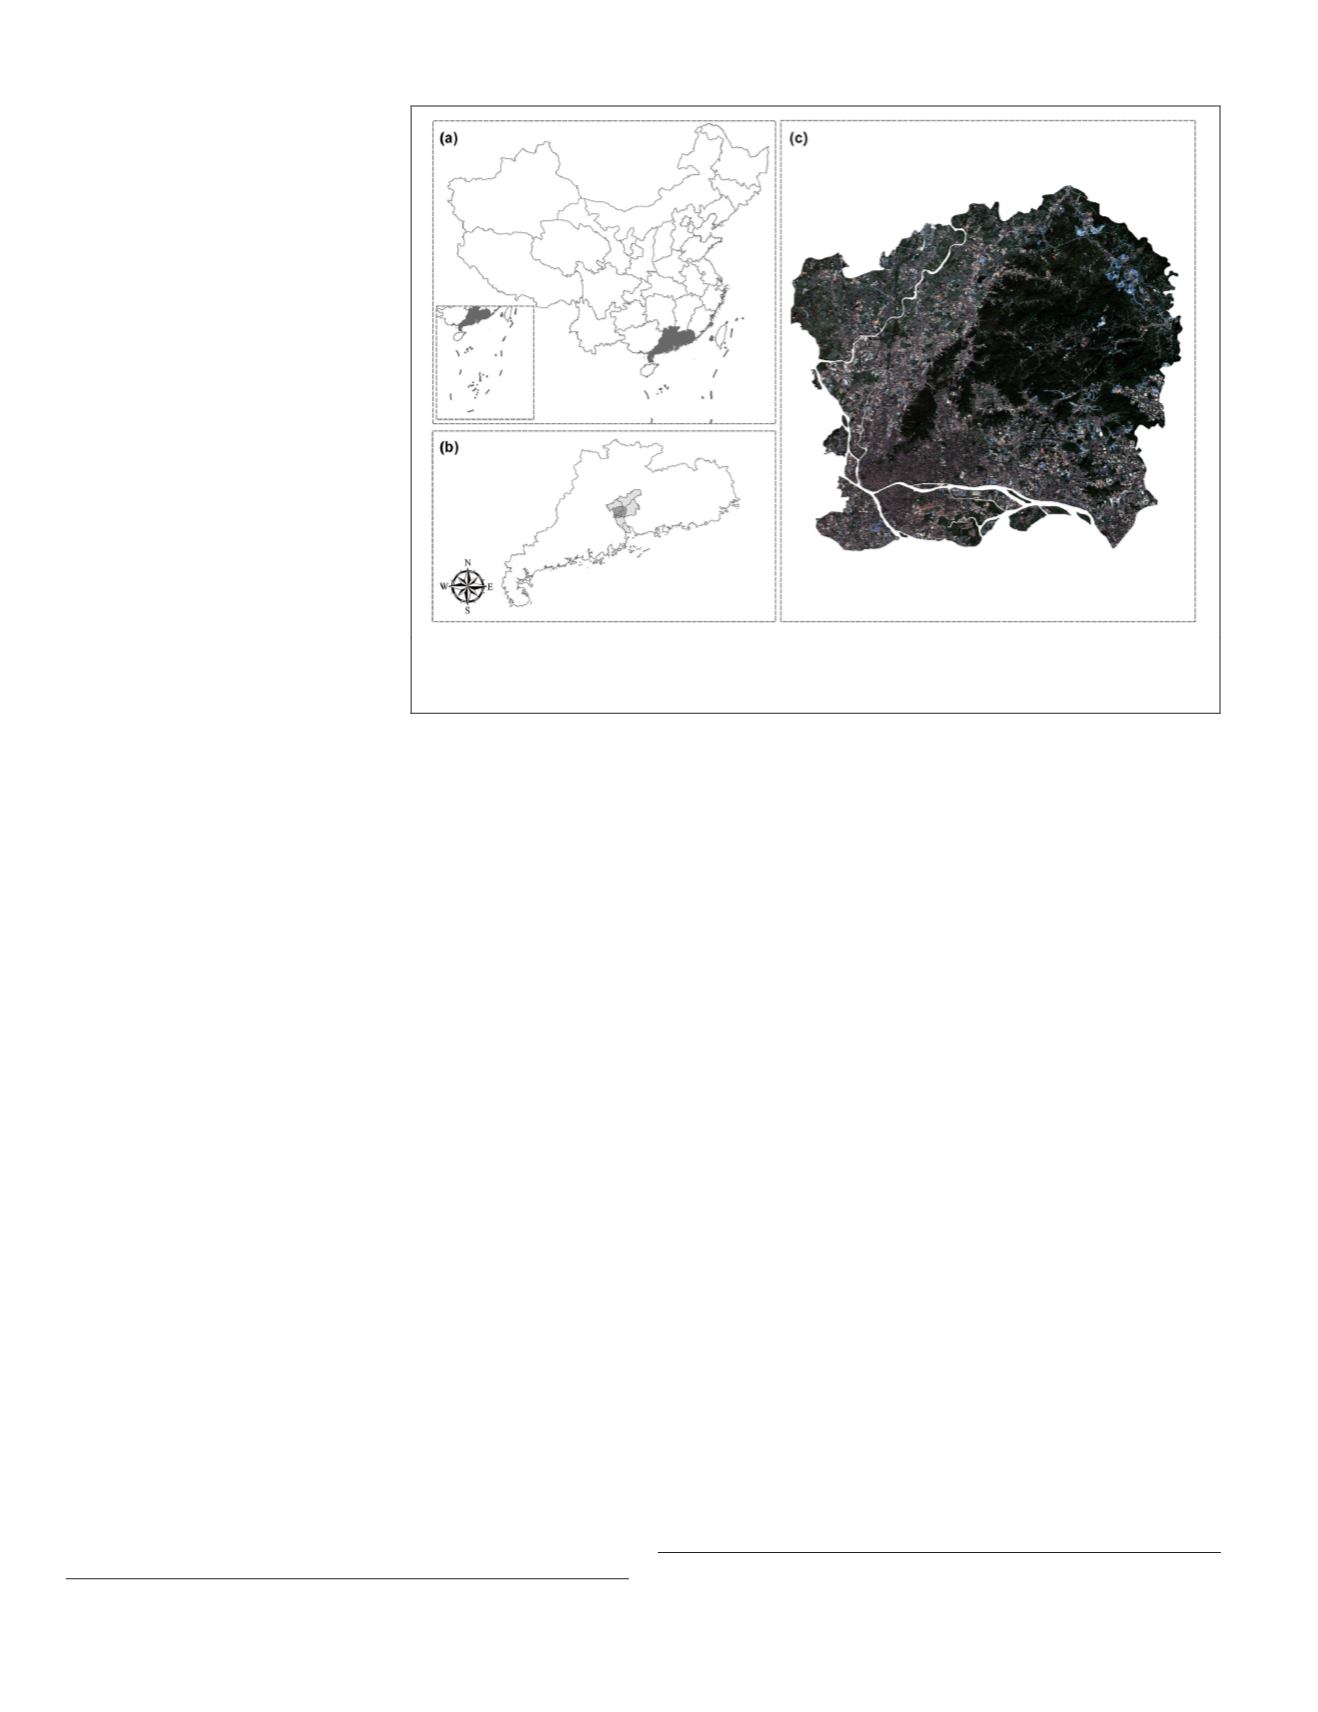
Study Area
Guangzhou, located in the south of China (112°57
′
E~114°3
′
E and 22°26
′
N~23°56
′
N), is one of the most populated cities
(with a population of 14.04 million). As the capital city and the
major port of Guangdong province, Guangzhou experienced
rapid development during the past 30 years. In this research,
we selected the central parts of Guangzhou City as our study
area, which cover several typical urban land use categories
including impervious surfaces such as commercial land, resi-
dential land, road, and parking lot, as well as pervious surfaces
such as park, forest, grassland, and bare soil (Figure 1).
Data Collection and Preprocessing
Remote Sensing Data
We adopted
Landsat-8
Operational Land Imager (
OLI
) imag-
ery (path 122/row 44) of Guangzhou acquired on 23 October,
2017, as our remote sensing data source. This multi-spectral
imagery, provided by U.S. Geological Survey
5
, has eight re-
flective bands of 30 m spatial resolution and one panchromat-
ic band of 15 m spatial resolution, with a low cloud coverage
proportion of 5%. This imagery was corrected with ground
control points and projected into
UTM WGS84
coordinate
system. After that, this dataset was converted to normalized
exo-atmospheric reflectance measures with the radiance to
reflectance conversion formula (Markham and Barker, 1987).
Also, all water bodies were masked out. Moreover, high-
resolution images on
Gaode Map
were used to collect the
reference data for training and accuracy validation, under the
assumption that there were no apparent changes happened
among
Landsat
imagery and online map due to the close
acquisition time.
Social Data
We gathered more than one million
POIs
of Guangzhou from
Gaode Map
by using an application programming interface
6
.
Each
POI
contains certain locational and functional informa-
tion, i.e.
ID
, category, and coordinate (latitude and longitude)
of a place. Different from the volunteered geographic infor-
mation collected from social media platforms like
Facebook
,
Twitter
or
Sina Weibo
(Chinese
Twitter
), the
POI
data used in
this work have already been collected, sorted, and verified by
the surveying and mapping team of
Gaode Map
by 23 June,
2016. It should be noticed that the acquisition time of remote
5.
6.
/
4.
Figure. 1. (a) Guangdong province, located in the south of China, (b) Guangzhou City, the
capital city of Guangdong province, is the main economic hub of the Pearl River Delta,
and (c) Remote sensing imagery of our study area, acquired by
Landsat-8
satellite.
772
December 2018
PHOTOGRAMMETRIC ENGINEERING & REMOTE SENSING


