However, by taking advantage of social data, the impervious
fractions can be well revised (see Figures 9c, and 9d).
We also calculated the histograms of bright imperviousness
and dark imperviousness to explore whether our proposed
method could well distinguish these two different land
covers. 512 random samples of bright imperviousness (256
samples) and dark imperviousness (256 samples) are collected
from
Gaode Map Online
manually. Figure 10 gives these his-
tograms, in which the bright areas (blue line) and dark areas
(read line) are well separated.
Several limitations still exist in our method. These are
related with: (1) shadows, (2) the specific distribution of
POIs
,
(3) the low density of pervious
POIs
, and (4) urban greening.
These uncertainties are difficult to be fully avoided, especially
with high spatial resolution imagery, which are exactly the
aspects that we are planning to address in further studies.
Conclusions and Future Research
High spatial resolution and accurate estimation of impervi-
ous fractions are widely required in urban management. The
accuracy of existing imagery-based
IS
estimation methods
are usually hindered by the heterogeneity of remotely sensed
imagery. To make progress in this direction, we exploited
the unique advantages of social data to cover the short-
ages brought by traditional remote sensing imagery. A new
approach which utilizes the combined strengths of remote
sensing data and social data is proposed. Physical features of
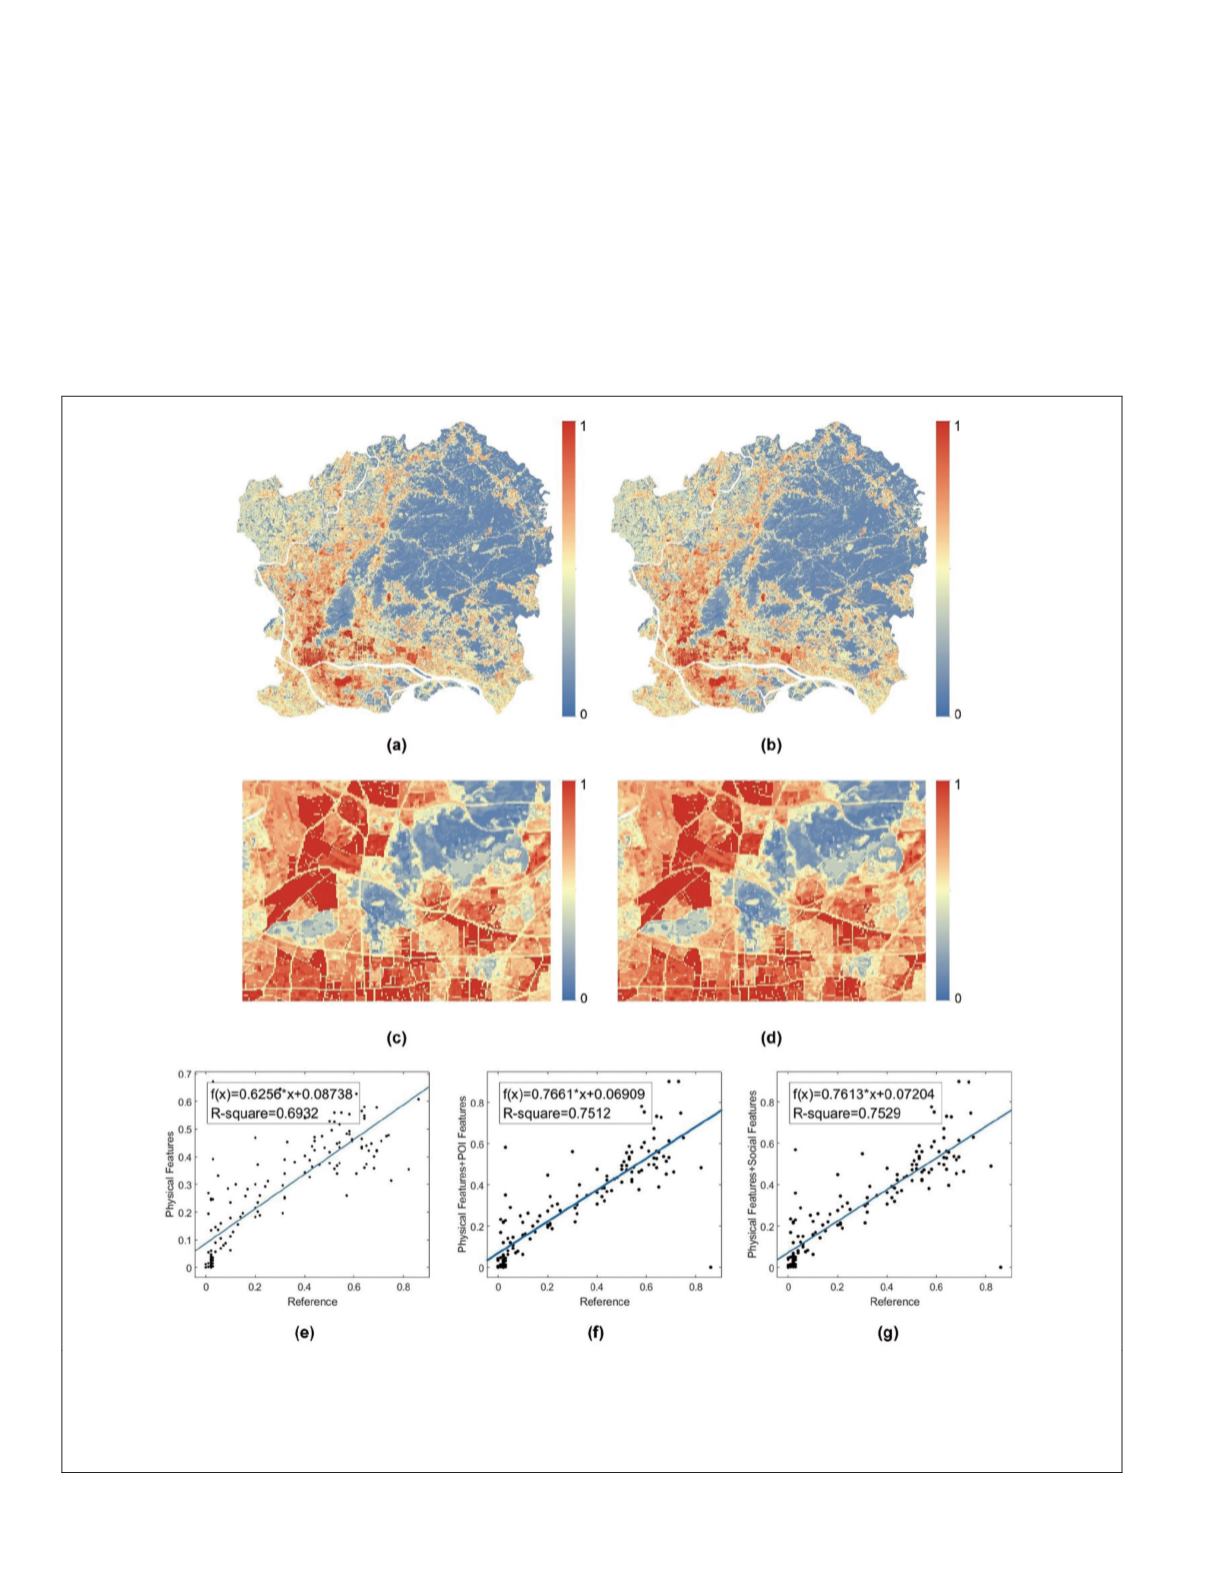
Figure 8. Parcel-based
IS
mapping result with (a) physical and
POI
features, and (b) physical and all social features; (c) and
(d) are two zoomed-in views of two obtained maps, respectively, in which the high and low impervious fraction parcels are
properly segmented; (e), (f) and (g) give the fitting curve of reference data versus impervious fractions, which are derived
from physical features, physical and
POI
features, physical and all social features, respectively. The R-square of each
figure is 0.6932, 0.7512, and 0.7529. Due to the low coverage rate of road network and the limited number of samples, the
contributions made by road network are not easy to indicate by R-square.
778
December 2018
PHOTOGRAMMETRIC ENGINEERING & REMOTE SENSING


