sensing data and social data should
be as close as possible, because of
the continuous construction of a
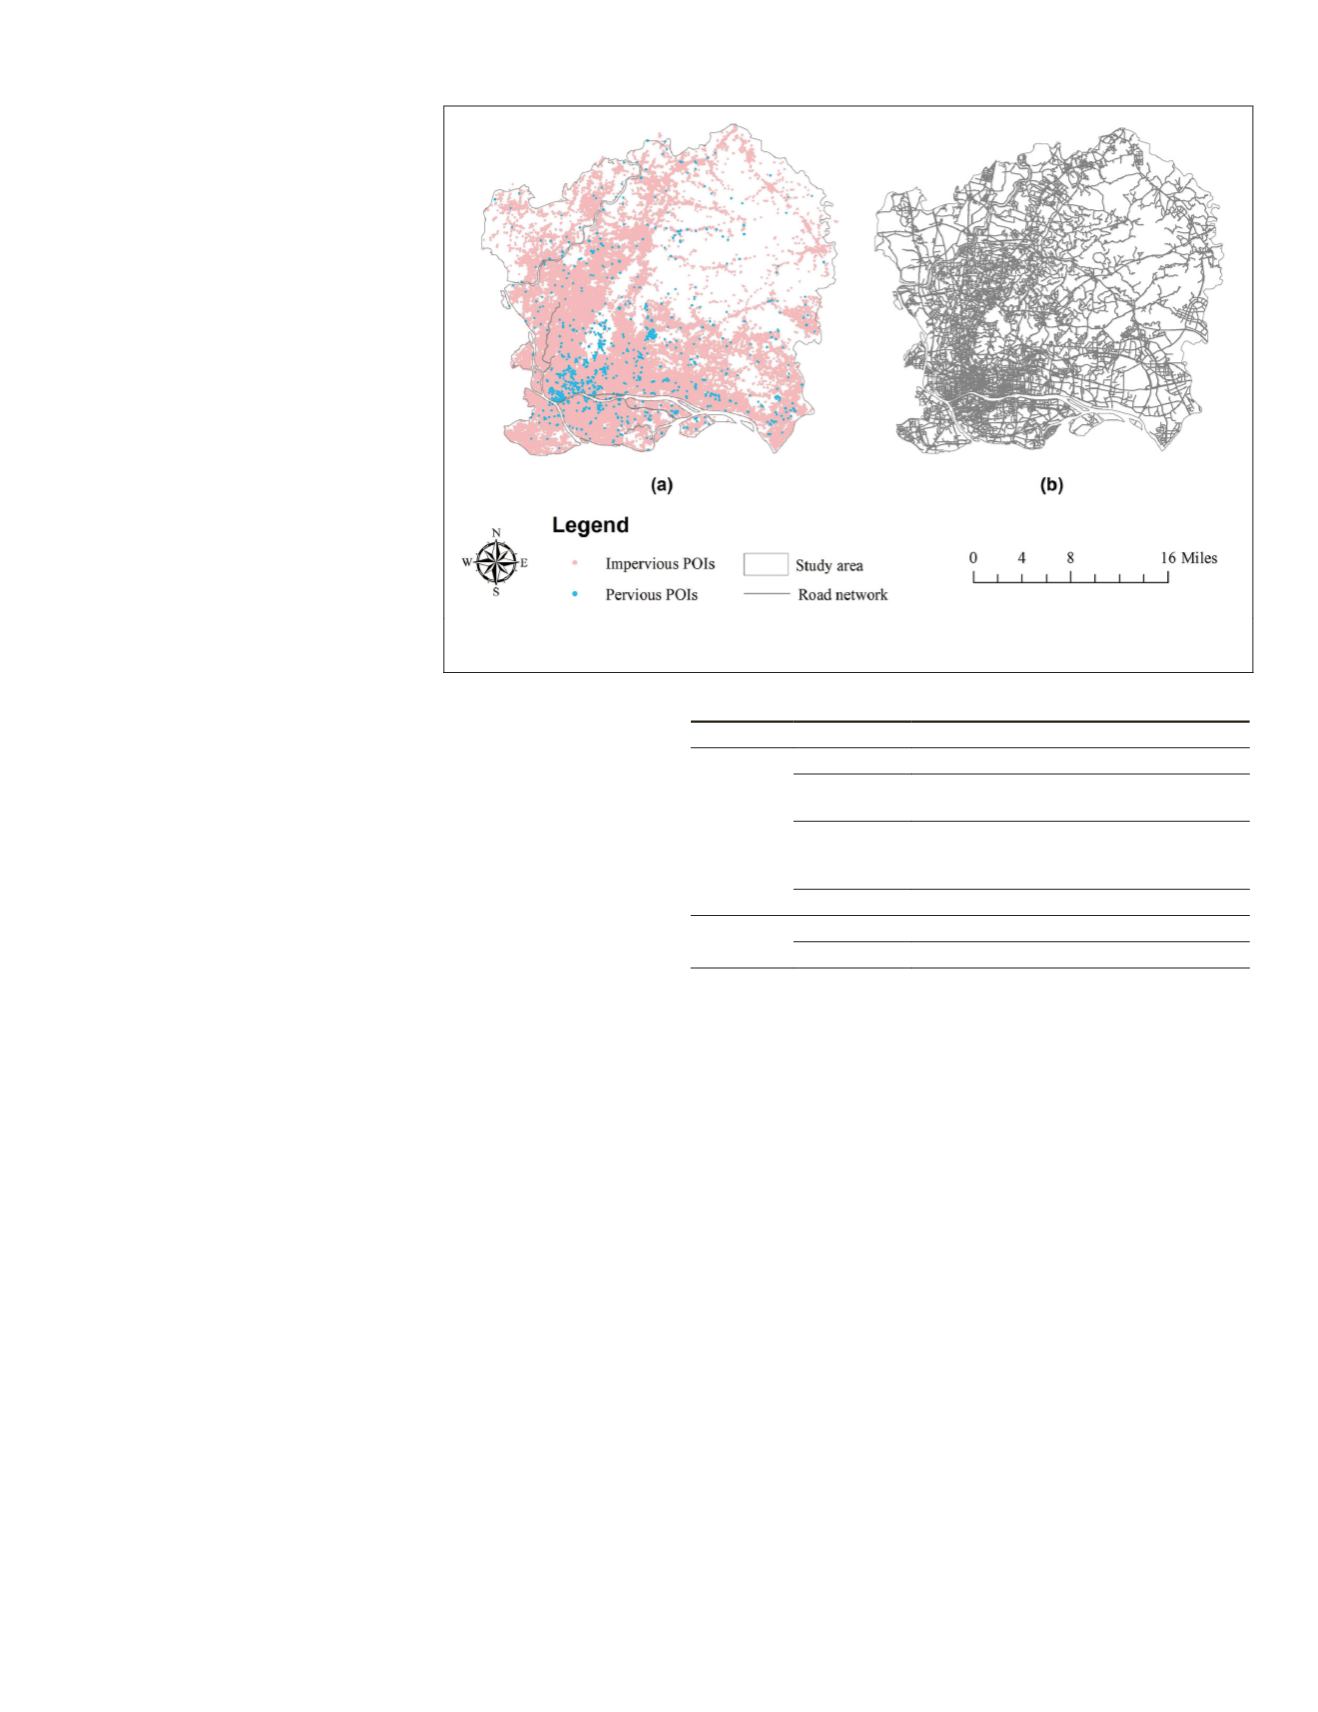
city. The initial 864 types of
POIs
were gathered into 2 categories
(see Table 1) including impervi-
ous point dataset (683,161
POIs
)
and pervious point dataset (1,337
POIs
), as shown in Figure 2a.
POIs
that did not belong to these two
categories were removed. It should
be noted that, with a total number
of 684,496 impervious and pervi-
ous
POIs
, the distribution of
POIs
,
although biased, i.e., there are less
POIs
in sub-urban areas than that in
urban areas, is good enough for the
exploration of the complementary
of remote sensing and social data.
Also we collected the road
network of study area from
OSM
(Figure 2b)). This vector dataset has
been recognized and classified by
street function/level (e.g., motor-
way, primary, secondary, trunk, ter-
tiary, residential, service, footway
,and relief road).
Methodology
Urban parcel, which can be bounded by road network, is
defined as the basic spatial unit carrying the social functions
in urban management and urban planning (Hu
et al
., 2016).
Recently, parcel based urban study models are widely applied
to better describe the urban function and capture the compre-
hensive and strategic urban planning (Liu and Long, 2016).
Urban parcel has been proved to be an effective data source
in urban function description (Yuan
et al
., 2012), which
has been a tremendous benefit to support urban manage-
ment decision-making. So in this work, we conducted two
IS
estimation experiments, i.e., pixel-based
IS
estimation and
parcel-based
IS
estimation to better present the contributions
brought by
POIs
and road network while seeing the differences
between the pixel-based and parcel-based method.
The framework of our proposed approach is illustrated in
Figure 3. First, we adopt
MAPs
and build four structural attri-
butes (area, length of bounding box, standard deviation, and
moment of inertia) that are then fed to a
SMA
model to esti-
mate the physical features of urban
IS
from Landsat-8 imagery.
Then, in the processing of social data, we extract two kinds
of social features based on pixel-level and parcel-level. These
two set of features (pixel-based and parcel-based features) are
then fused into a multivariable
LRM
, respectively, to provide
an estimation of
IS
. In the following, we detail each step of the
adopted method.
Physical Features Extraction
In this study, the physical features are derived by using a
morphological attribute profiles-guided spectral mixture
analysis model following the previous successful instructions
(Zhu
et al
., 2018). It should be note that, physical information
is reserved in some aspects by feeding the original bands of
multispectral imagery into
MAPs
. Meanwhile, previous stud-
ies (Zhu
et al
., 2018) as well as our experiment results have
shown its promising performance with a acceptable accuracy
in physical feature extraction. Nevertheless, how to interpret
its physical information is still a remaining challenge. Future
efforts can be undertaken for further improvement.
According to Zhu
et al
. (2018), first we extract the spatial
features from remote sensing imagery using
MAPs
with four
different structural attributes, including area, length of bound-
ing box, standard deviation, and moment of inertia.
MAPs
are
derived by generating the attribute profile (AP) on each band
of multispectral imagery. For pixel
x
i
,
MAP
can be defined as:
MAP
(
I
) = {
AP
(
I
1
),
AP
(
I
2
),…,
AP
(
I
P
)}
(1)
where
AP
(
I
P
) is the attribute profile of feature
p
. These spatial
features derived above are then fed to an
SMA
model to esti-
mate the multiple spectral signatures and their correspond-
ing abundance. As Wu and Murray (2003) suggested that the
impervious surfaces are likely to be the combination of high-
albedo and low-albedo fraction images, we consider the high
and low albedo endmembers to linearly represent the initial
impervious fractions, which is given by:
F
b
=
ω
low
,
F
low,b
+
ω
high
,
F
high,b
+
e
b
(2)
where
F
b
is the initial impervious fractions of band
b
,
F
low,b
and
F
high,b
are the low-albedo and high-albedo spectra of band
b
,
ω
low
and
ω
high
are the weight of low-albedo and high-albedo,
respectively, and
e
b
is the un-modeled residual. Equation 2
should follow the assumption that
ω
low
+
ω
high
= 1 while
ω
low
,
ω
high
≥
0. In this work, we consider the obtained initial impervi-
ous fractions as the physical features of remote sensing imag-
ery. This leads to the following definition of physical features:
Table 1.
POI
classification system.
Class I
Class II
Descriptions
Impervious
POIs
Industrial Warehousing, manufacturing, recycling
Commercial
Automotive service, restaurant place,
department store, shopping center, hotel
Institutional
Government service, transportation,
sports complex, hospital, educational
place, cultural venues and facilities
Residential Community, service apartment
Pervious
POIs
Water body Lake, river
Green space Park, scenic spot, tourist area
Figure 2. (a)
POIs
of imperviousness and perviousness, and (b) Road network acquired
from
OSM
.
PHOTOGRAMMETRIC ENGINEERING & REMOTE SENSING
December 2018
773


