f
1
= {
F
1
,
F
2
,…,
F
b
}.
(3)
It might also be note that param-
eters of Equations 1 and 2 are se-
lected following Zhu
et al
. (2018).
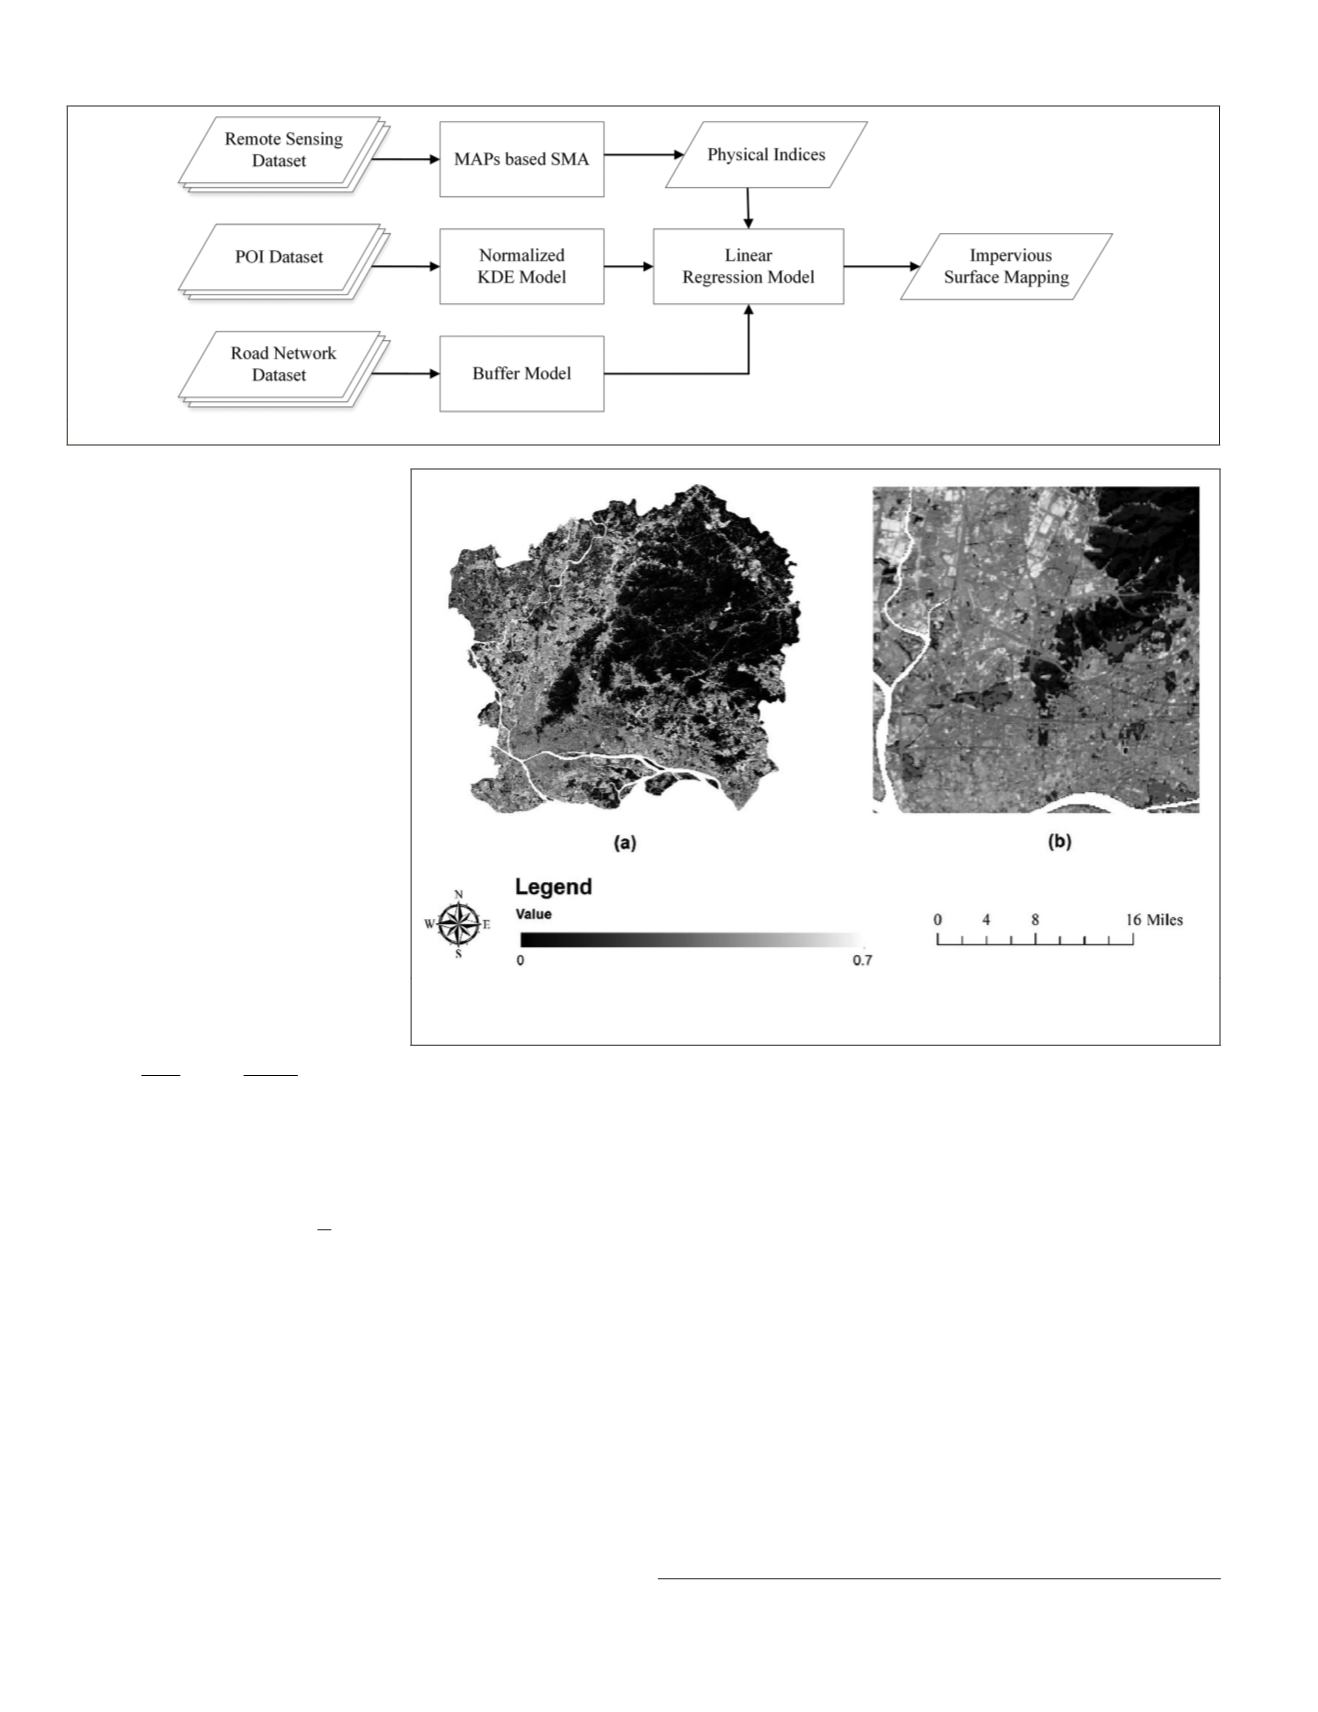
The physical features of Landsat-8
imagery are shown in Figure 4a.
Social Data Processing
POI Dataset
Kernel density estimation (
KDE
)
model (Silverman, 1986) is an
effective technique to converse
independent points into con-
tinuous density map with a proper
radius of influence (Meng
et al
.,
2017). This technique is widely
used in identifying city functions
(Yuan
et al
., 2012), flood assess-
ment (Schnebele, 2013), land over
change detection (Meng
et al
.,
2017), etc. In this work, we use
KDE
model to estimate the distributions
of impervious and pervious
POIs
,
respectively, as follows:
M x
pnh
K
x x
h
i
i
n
( )
=
−
=
∑
1
1
(4)
where {
x
1
,…,
x
n
}
are the set of
n
independent
POIs
,
k
is the
quartic (biweight) kernel function given by:
K u
u
( )
= −
(
)
3
1
2 2
π
(5)
while
u
≤
1.
h
is the search radius, which is generally set ac-
cording to the spatial resolution of remote sensing imagery
and the distribution of the
POIs
. In this work, we implement
the
KDE
model to generate the intensity of impervious
POIs
and pervious
POIs
with the search radius of 200m and 400m,
respectively. Due to the huge gap of data quantity among
these two
POI
datasets, we normalize two density maps by (Hu
et al
., 2016):
f
M M M M
2 3,
min
max min
/
= −
(
)
−
(
)
,
(6)
where
f
2
and
f
3
are the normalized kernel density maps of
impervious and pervious
POIs
, respectively. Two smooth maps
indicate the density of two
POI
datasets, and pixels/regions
with higher density values mean that there are more
POIs
, see
Figure 6.
Processing of the Road Network Dataset
In this study, to simulate road covers, we buffer the road
network with different road widths, e.g., 25 m, 20 m, 20 m,
15 m, and 10 m for motorway, primary, secondary, tertiary
and residential, respectively, referring to China Ministry of
Housing and Urban-Rural Development
7
, see Figure 5a. Then,
10,978 vector urban parcels are generated after removing road
spaces (Figure 5b).
Feature Integration
A multivariable linear regression model is implemented to
fuse the obtained physical and social features, as follows:
IS f
f
f
i
i
i
n ni
= + + +
ω ω
ω
1 1 2 2
…
,
(7)
where
f
n
presents the abundance map of feature
n
.
ω
n
is the
parameter controlling the weight of feature
n
. In this work, we
select 100 training samples (90 m
×
90 m) to learn the weight
of each feature based on least square method. Then,
7.
/
Figure 3. Graphical illustration of the proposed approach.
Figure 4. (a) Physical features of
Landsat-8
imagery, and (b) is the zoomed-in view of
old town area (Yuexiu district). This area holds the low impervious fractions for the
existence of countless tree crowns and parks.
774
December 2018
PHOTOGRAMMETRIC ENGINEERING & REMOTE SENSING


