Drift Compensation Model
Compared with the affine compensation model, the drift
compensation model bridges multiple strips. According to
Equation 11, the variance of adjacent strips is independent of
the lateral overlap after eliminating the compensation param-
eters
e
2
,
e
5
. In this case, the variance of any point is associated
with the row coordinate, and the maximum cofactor is 1.5 at
both ends, corresponding to 1.22
σ
0
. If the scheme of setting tie
points is as in Figure 2 and the weights are equal,
p
1
=
p
2
, the
weights of the
j
th
strip in row
p
r
j
and columns
p
c
j
can be calcu-
lated from the
j-1
th
strip with Equations 13 and 15 as:
p
p
p
p
p
p
r
j
r
j
r
j
c
j
c
j
c
j
=
+
=
+
−
−
−
−
2
2
1
2
2
1
1
1
1
1
(18)
The weights of first strip are
p
0
r
= 1 and
p
0
c
= 2. Then,
p
r
=
0.5 and
p
c
= 1, if
j
∞
. In theory, the maximum cofactor is 2 in
the line and 1 in the sample when the number of strips is in-
finite. The variance and standard deviation would be reduced
if the number of tie points in the overlap were increased.
Dataset and Experiments
Four
ZY-3
strips are used for the experiments, including Orbit
2890, Orbit 3939, Orbit 3642, and Orbit 28051. The first three
strips were captured by
ZY3
-02, which carries three line cam-
eras consisting of forward (
FWD
) and backward (
BWD
) cameras
with a 2.7-m ground sample distance (
GSD
) and a nadir (
NAD
)
camera with a 2.1 m
GSD
. The forth strip, Orbit 28051, was
acquired by
ZY3-01
, whose
BWD
and
FWD
cameras have GSDs of
3.5 m, and whose
NAD
camera has a
GSD
of 2.1 m. The overlap
of a single stereo pair, consisting of
BWD
and
FWD
images, is
almost 100%, as illustrated in Figure 5. Each strip consists of
two continuous scenes, with which virtual strip scenes are es-
tablished for block adjustment (Zhang
et al.,
2014). The lateral
overlaps between the adjacent strips are 21.5%, 46.0%, 14.2%,
and 15.0%. The different swath between
ZY3-01
and
ZY3
-02
causes a different lateral overlap between Orbit 28051 and
Orbit 3642. Detailed dataset information is listed in Table 1.
This dataset covers several cities around Changsha, Hunan
Province of China. A total of 108
GCPs
, distributed evenly
throughout the dataset, were used as either control points or
check points in the experiments, as shown in Figure 5. These
points were measured by GPS with an accuracy of approxi-
mately 0.1 m in both planimetry and height.
Two experiments were carried out, and they included the
use of tie points and a comparison of affine compensation
with drift compensation. In the first experiment, two adjacent
stereo pairs were used to study the impact of distribution and
number of tie points on the accuracy of block adjustment.
Four strips were used to compare the drift compensation
model and affine compensation model with different numbers
and distribution of
GCPs
.
Results and Discussion
The
FWD
and
BWD
images of Orbit 3939 and Orbit 3642 were
used in the first experiment because of their similar resolu-
tion and large lateral overlap. Four different sets of tie points
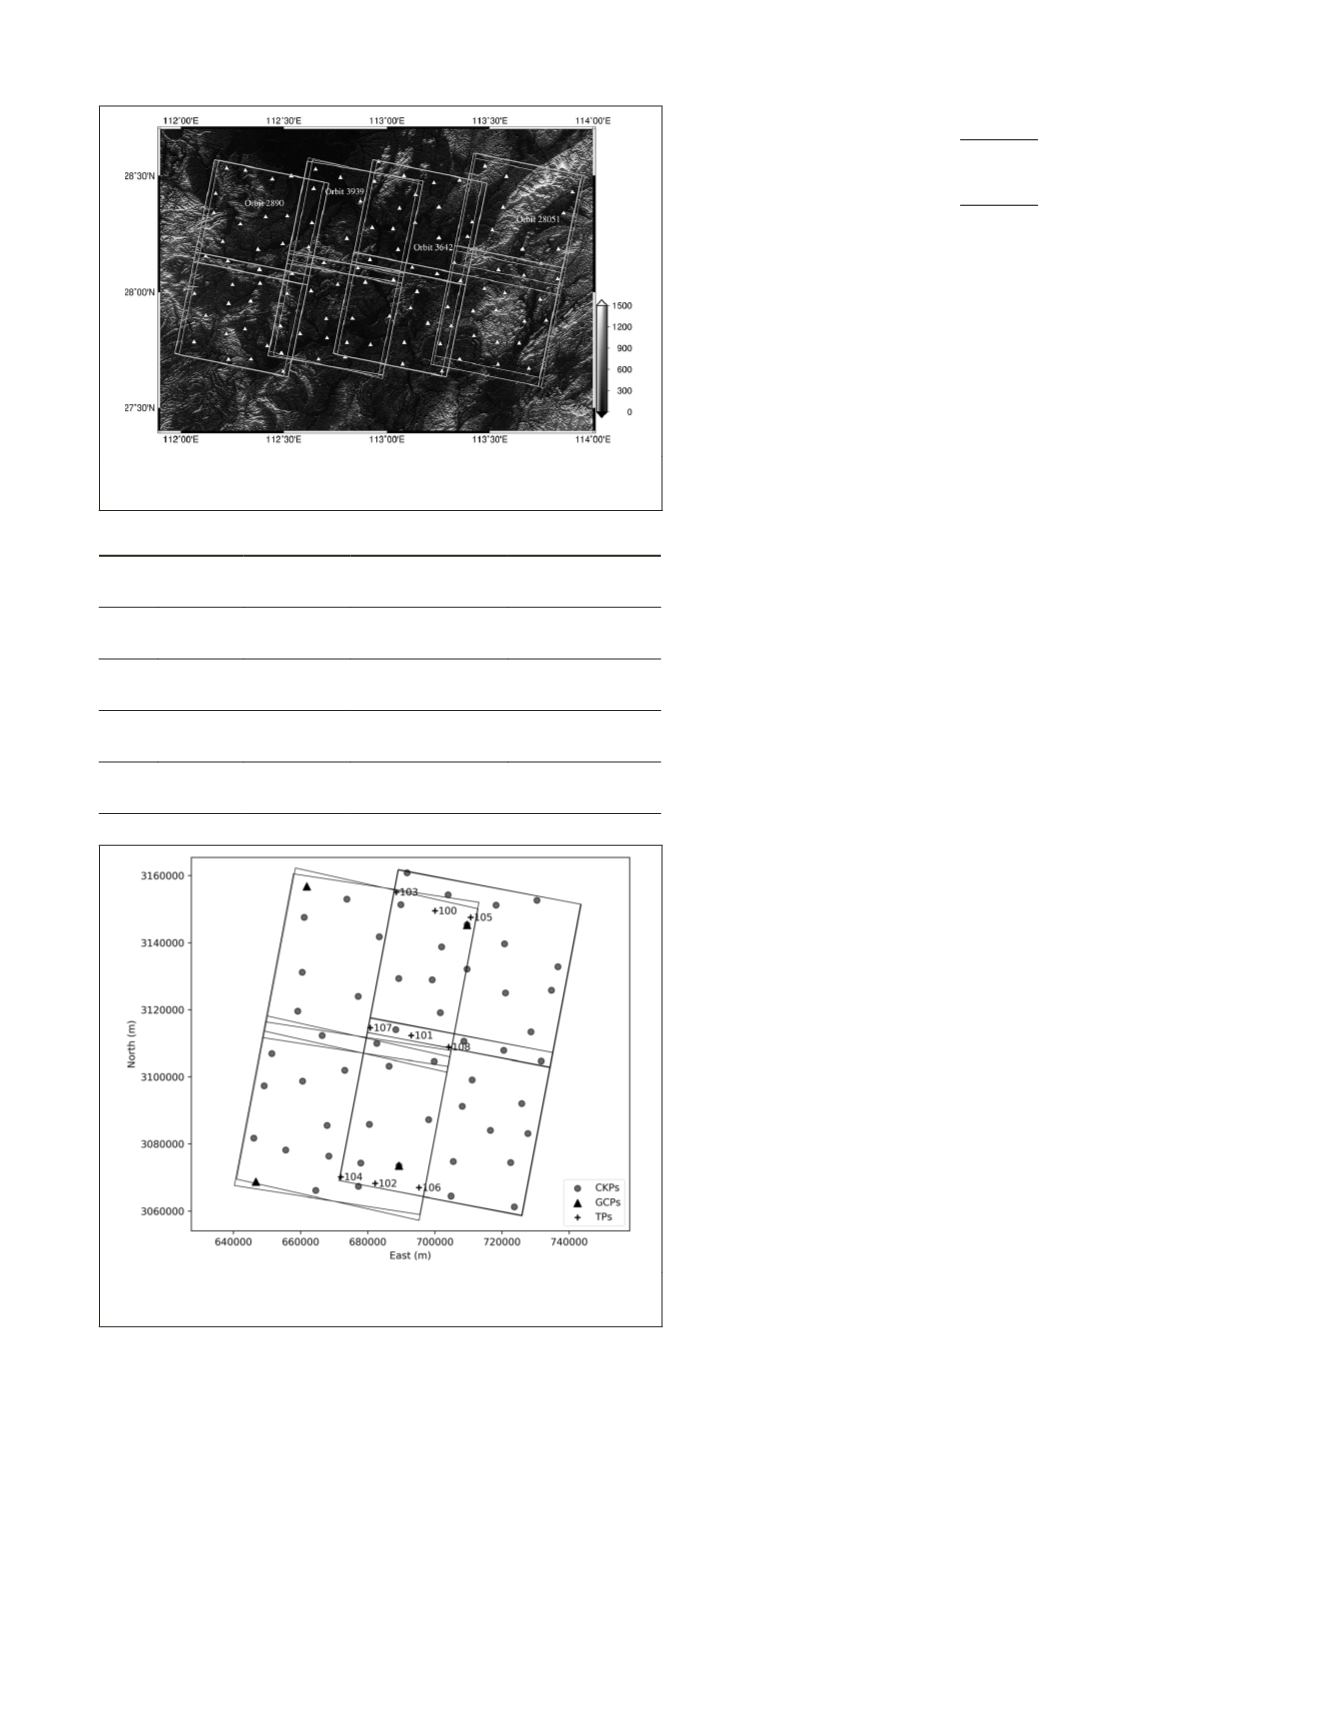
were designed for the experiment, with nine tie points in
total, as shown in Figure 6. In the first case, all three tie
points, numbers 100-102, were almost in the same column.
The second set consisted of four tie points, numbers 103-106,
around the corners of the common area. With six tie points,
numbers 100-104 and number 107, the third set was designed
for reducing the lateral overlap to 23.4%. In the last case, nine
tie points were distributed evenly throughout the common
area. To isolate the role of tie points, only
GCPs
and tie points
were involved in solving the parameters, and the checkpoints
were excluded. After that, the difference between the mea-
sured object and the intersected object coordinates of the 36
checkpoints in Orbit 3642 were used to evaluate accuracy.
The root-mean-square error (
RMSE
) of the checkpoints in
Orbit 3939 was 1.77 m in planimetry and 1.34 m in height
when four
GCPs
were deployed around the four corners of the
stereo pair. The
RMSE
and maximum error of the checkpoints
Figure 5. Distribution of the boundaries of
GCPs
and scenes
overlaid on the digital elevation model (
DEM
).
Table 1. Basic information of four strips
Strip
ID Satellite
Capturing
Time
GSD
Lateral Overlap of
Adjacent Strips
Orbit
2890
ZY3-02 2017-02-13
NAD 2.1 m
FWD/BWD 2.7 m
21.5%
Orbit
3939
ZY3-02 2016-12-16
NAD 2.1 m
FWD/BWD 2.7 m
46.0%
Orbit
3642
ZY3-02 2016-12-06
NAD 2.1 m
FWD/BWD 2.7 m
14.2%
Orbit
28051
ZY3-01 2016-01-24
NAD 2.1 m
FWD/BWD 3.5 m
15.0%
Figure 6. Distribution of two adjacent stereo pair images,
GCPs
, checkpoints, and tie points.
PHOTOGRAMMETRIC ENGINEERING & REMOTE SENSING
December 2018
795


