the iron-bearing and iron-free litholo-
gies in the studied outcrop.
So as to verify the advantage of
combining spectral data from
VNIR
and
SWIR
cameras, the image classifi-
cation was performed in two separate
ways: (1) using the co-registered
VNIR
+
SWIR
image, and (2) using only
the
SWIR
image, commonly preferred
in geological studies. Individual
MNF
components or false color compos-
ites of these components cannot
be used for comparison between
different images as the transforma-
tion is unique for the input image;
however, the false-color composites
have proven to be successful for
initial interpretation in hyperspec-
tral images (Harris
et al
., 2005). An
initial interpretation of the
MNF
false
color composites created based on
VNIR
+
SWIR
and
SWIR
images revealed
prominent lithological units in the
studied outcrop (Figure 7B and 7D).
Spatially coherent
MNF
components
were then used in the Mixture-tuned
Match Filtering (
MTMF
) classification
using end-member spectra extracted
directly from
VNIR
+
SWIR
and
SWIR
im-
ages separately. Each class is defined
by a score of at least 0.5, representing
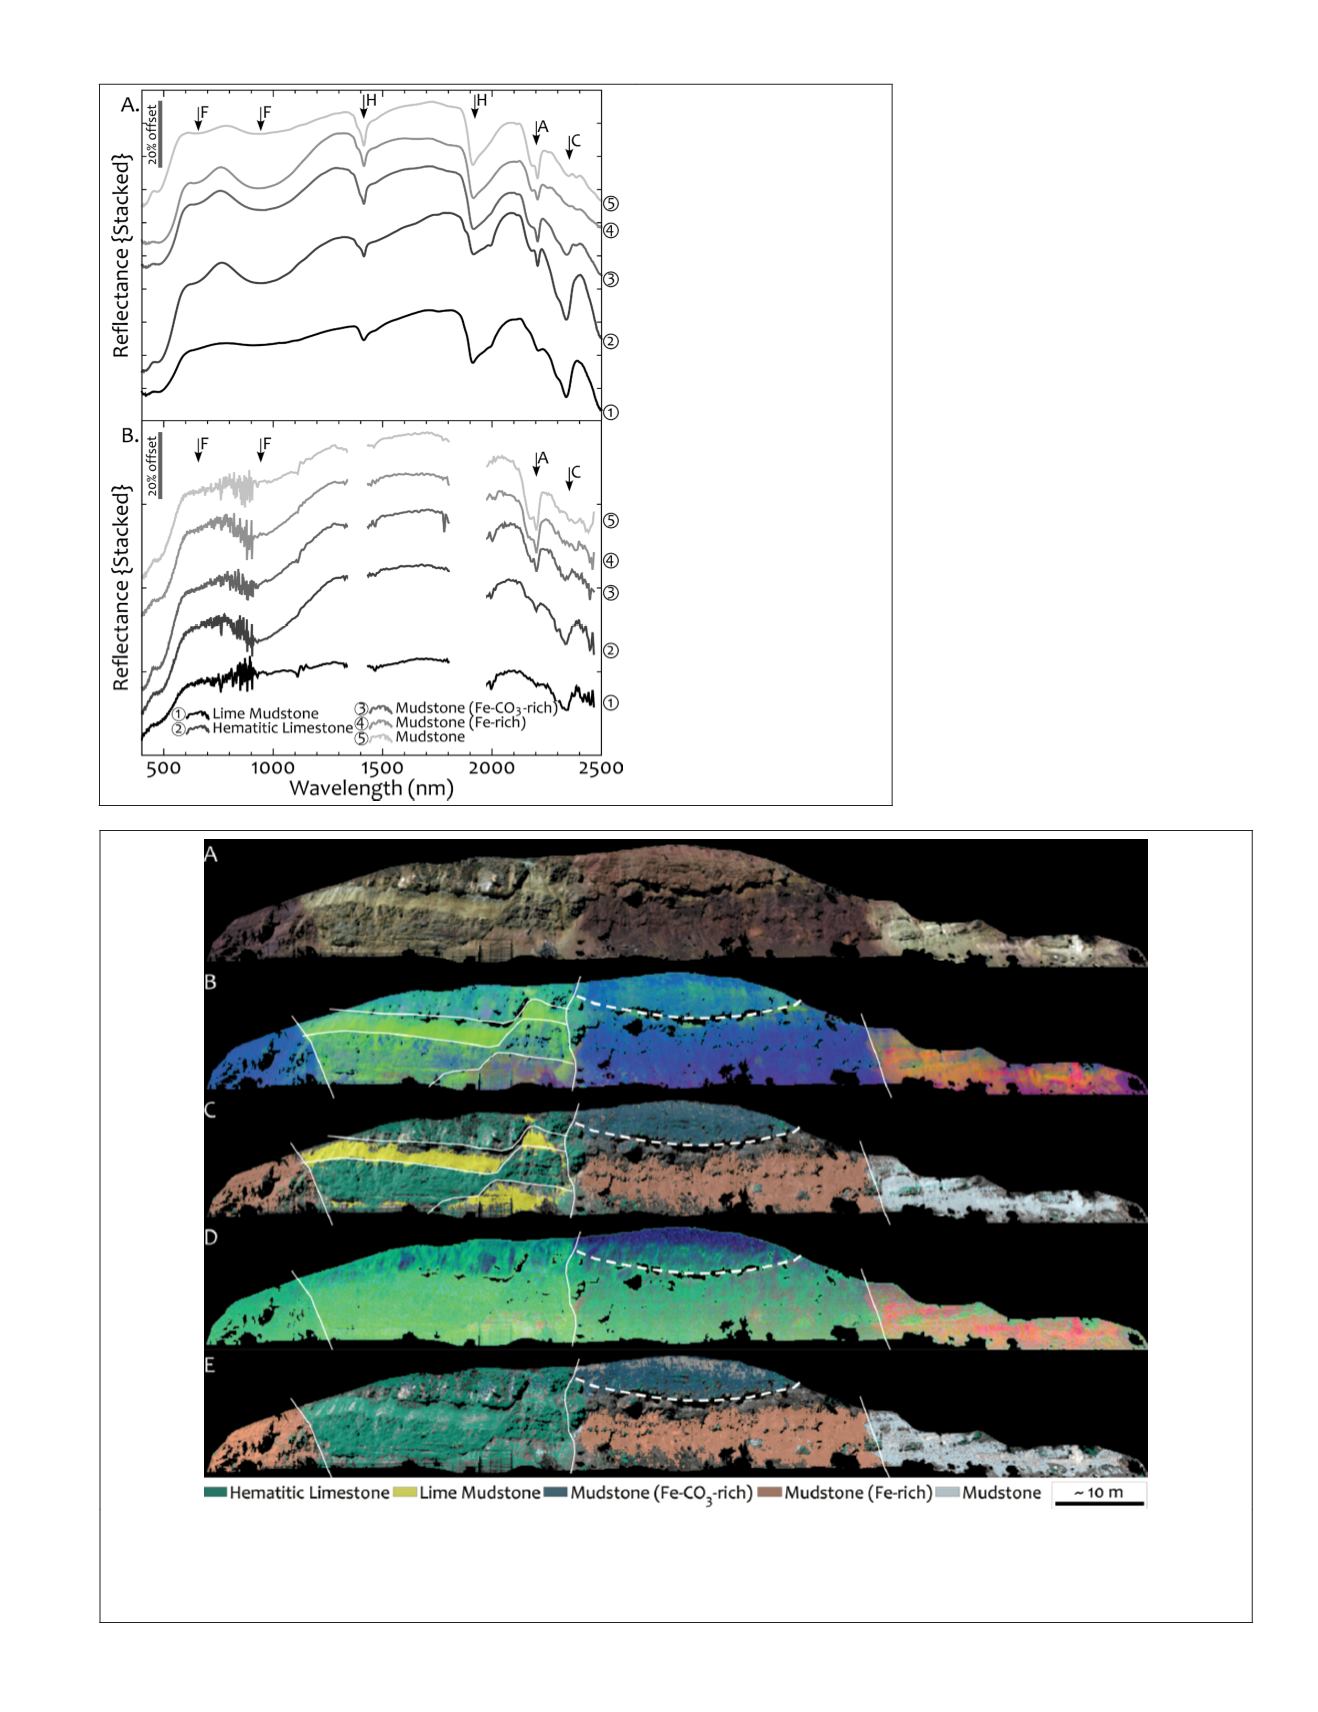
Figure 7. (A) Approximate true color composite of the scanned exposure: spectral bands at 640, 550, and 470 nm are
displayed in
RGB
. False color
MNF
image created from (B) co-registered
VNIR+SWIR
images with components 2, 5, and 6 in
RGB
and (D)
SWIR
image with components 1, 3 and 6 in
RGB
.
MTMF
classification results using (C) co-registered
VNIR+SWIR
images
and (E)
SWIR
image. White lines indicates the initial interpretation of distinct lithologies on the studied outcrop based on
MNF
components and field observations.
Figure 6. Representative
reflectance profiles of the
prominent lithologies in the
studied exposure (A) ob-
tained from laboratory spec-
troscopy, and (B) extracted
from co-registered hyper-
spectral images. H: indicates
water absorption features at
around 1400 nm and 1900
nm; C: indicates carbon-
ate absorption features at
around 2340 nm; and F:
indicates ferric oxide absorp-
tion features at around 670
nm and 900 nm. Atmospher-
ic absorption wavelengths at
around 1400 nm and 1900
nm are masked.
PHOTOGRAMMETRIC ENGINEERING & REMOTE SENSING
December 2018
787


