and verified qualitatively by visually examining their place-
ment. Considering overall
RMSe
, individual point error and er-
ror distribution, and placement of homologous points, first-or-
der polynomial transformation using the points from the third
SIFT
run was found to be the most feasible and thus, final image
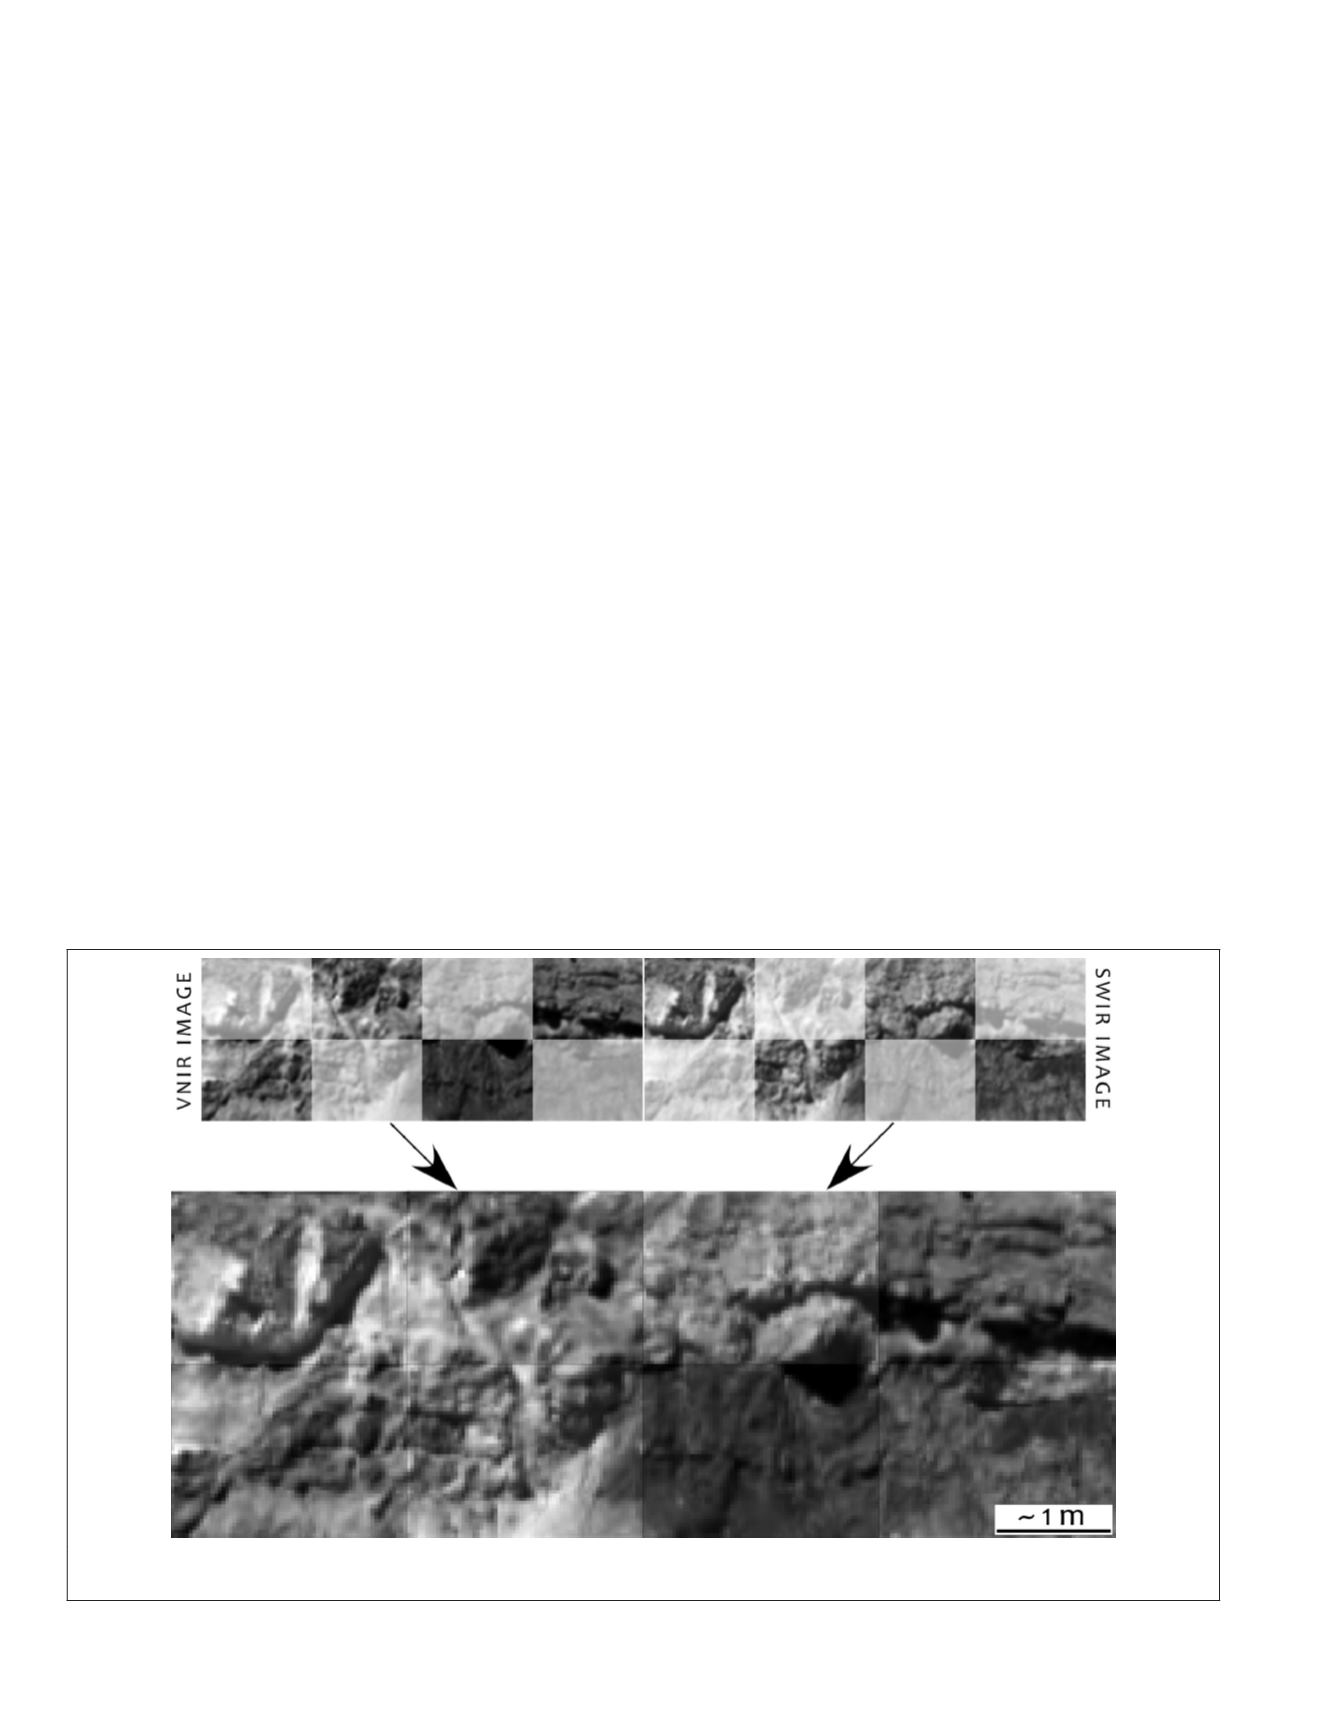
co-registration was performed accordingly. Figure 5 shows a
subset of the final co-registered hyperspectral images.
Regardless of the input data type and characteristics, the
SIFT
algorithm is frequently applied using the default param-
eters suggested by Lowe (2004) and in many cases the default
parameters provided satisfactory number of points. Similarly,
in this study the default parameters of
SIFT
were used with-
out tuning them. Although the results yielded satisfactory
co-registration accuracy, the numbers of matching points, and
thus the quality of geometric registration can be improved
through optimizing the
SIFT
parameters, particularly for non-
overlapping spectral ranges (Sima and Buckley, 2013). For in-
stance, some extensions and modifications to
SIFT
have been
proposed so as to increase matching performance between
multispectral data collected in different spectral ranges (e.g.,
Yi
et al
., 2008 and Aguilera
et al
., 2012). Also, modification of
SIFT
parameters have been proven successful for identification
and matching of homologous points between
SWIR
hyperspec-
tral imagery and
VIS
digital images (Sima
et al
., 2012). That
being said, the
SIFT
algorithm is controlled by as many as 17
parameters (May and Turner, 2010) which makes optimization
procedure increasingly complex and not practical. Therefore,
in addition to number of octaves depending on the size of the
input images, focusing only on optimization of five key pa-
rameters, namely, number of scales, sigma for Gaussian blur,
contrast threshold, edge threshold, and nearest neighbor ratio
is suggested (Sima and Buckley, 2013). In addition to param-
eter optimization in
SIFT
, geometric registration of panoramic
ground-based hyperspectral images could further benefit from
a camera-model-based transformation which takes intrinsic
geometric properties of the cameras into account for image
transformation (Schwind
et al
., 2014).
Spectral Analysis and Image Classification
The laboratory reflectance spectra of the collected rock samples
were acquired from seemingly homogeneous areas in terms
of color and texture. Due to its discrete nature, laboratory
spectroscopy is a non-exhaustive representation of the outcrop;
nevertheless, it provides insight about the general spectral pat-
terns and features of the samples. Regardless of the lithology,
all analyzed samples have absorption features at around 1900
nm and, though not as strong, at around 1400 nm indicative
of H
2
O in the samples. Excluding the water absorption, there
are apparent absorption features: (1) at around 670 nm and 900
nm indicative of ferric oxide, (2) at around 2200 nm indicative
of Al-OH, and (3) at around 2340 nm indicative of carbonate
minerals (Figure 6A). Some of these absorption features can
be used singly or in combination to identify and map surface
lithology in the ground-based hyperspectral images depending
upon their properties and strength, and spectral resolution of
the hyperspectral data. Excluding the wavelengths dominated
by atmospheric absorption and dominated by noise within the
spectral range of the
VNIR
camera, spectral profiles of the prom-
inent lithologies in the scanned outcrop obtained from hyper-
spectral images and laboratory spectroscopy are in a very close
agreement. The representative spectral profiles of the promi-
nent lithologies in the studied outcrop are given in comparison
with hyperspectral image spectra (Figure 6). The 670 nm, 2200
nm, and 2340 nm absorption features are easier to recognize
and can be individually identified as each of these features
falls within the spectral range of either the
VNIR
or
SWIR
hyper-
spectral camera. However, the absorption feature around 900
nm important for identifying minerals that contain transition
metals such as Cu, Mn, and particularly Fe (e.g., Hematite,
Goethite, and Jarosite) straddle the spectral boundaries of
VNIR
and
SWIR
cameras. Therefore, using any of the cameras singly
has a significant impediment to detection of this absorption
feature. Continuous
VNIR
+
SWIR
image spectra obtained through
spatial co-registration and spectral concatenation allowed the
identification of this absorption feature (Figure 6B), which
could potentially improve the separation and classification of
Figure 5. A subsection of
VNIR
and
SWIR
scenes after spatial image co-registration. Subsections of two separate scenes are
given in a checkerboard pattern; notice the continuity of the surface features.
786
December 2018
PHOTOGRAMMETRIC ENGINEERING & REMOTE SENSING


