categories are (1) non-saline soil (0-2 dS·m
-1
), (2) slightly
saline soil (2-4 dS·m
-1
), (3) moderately saline soil (4-8 dS·m
-1
)
and (4) strongly saline soil (>8 dS·m
-1
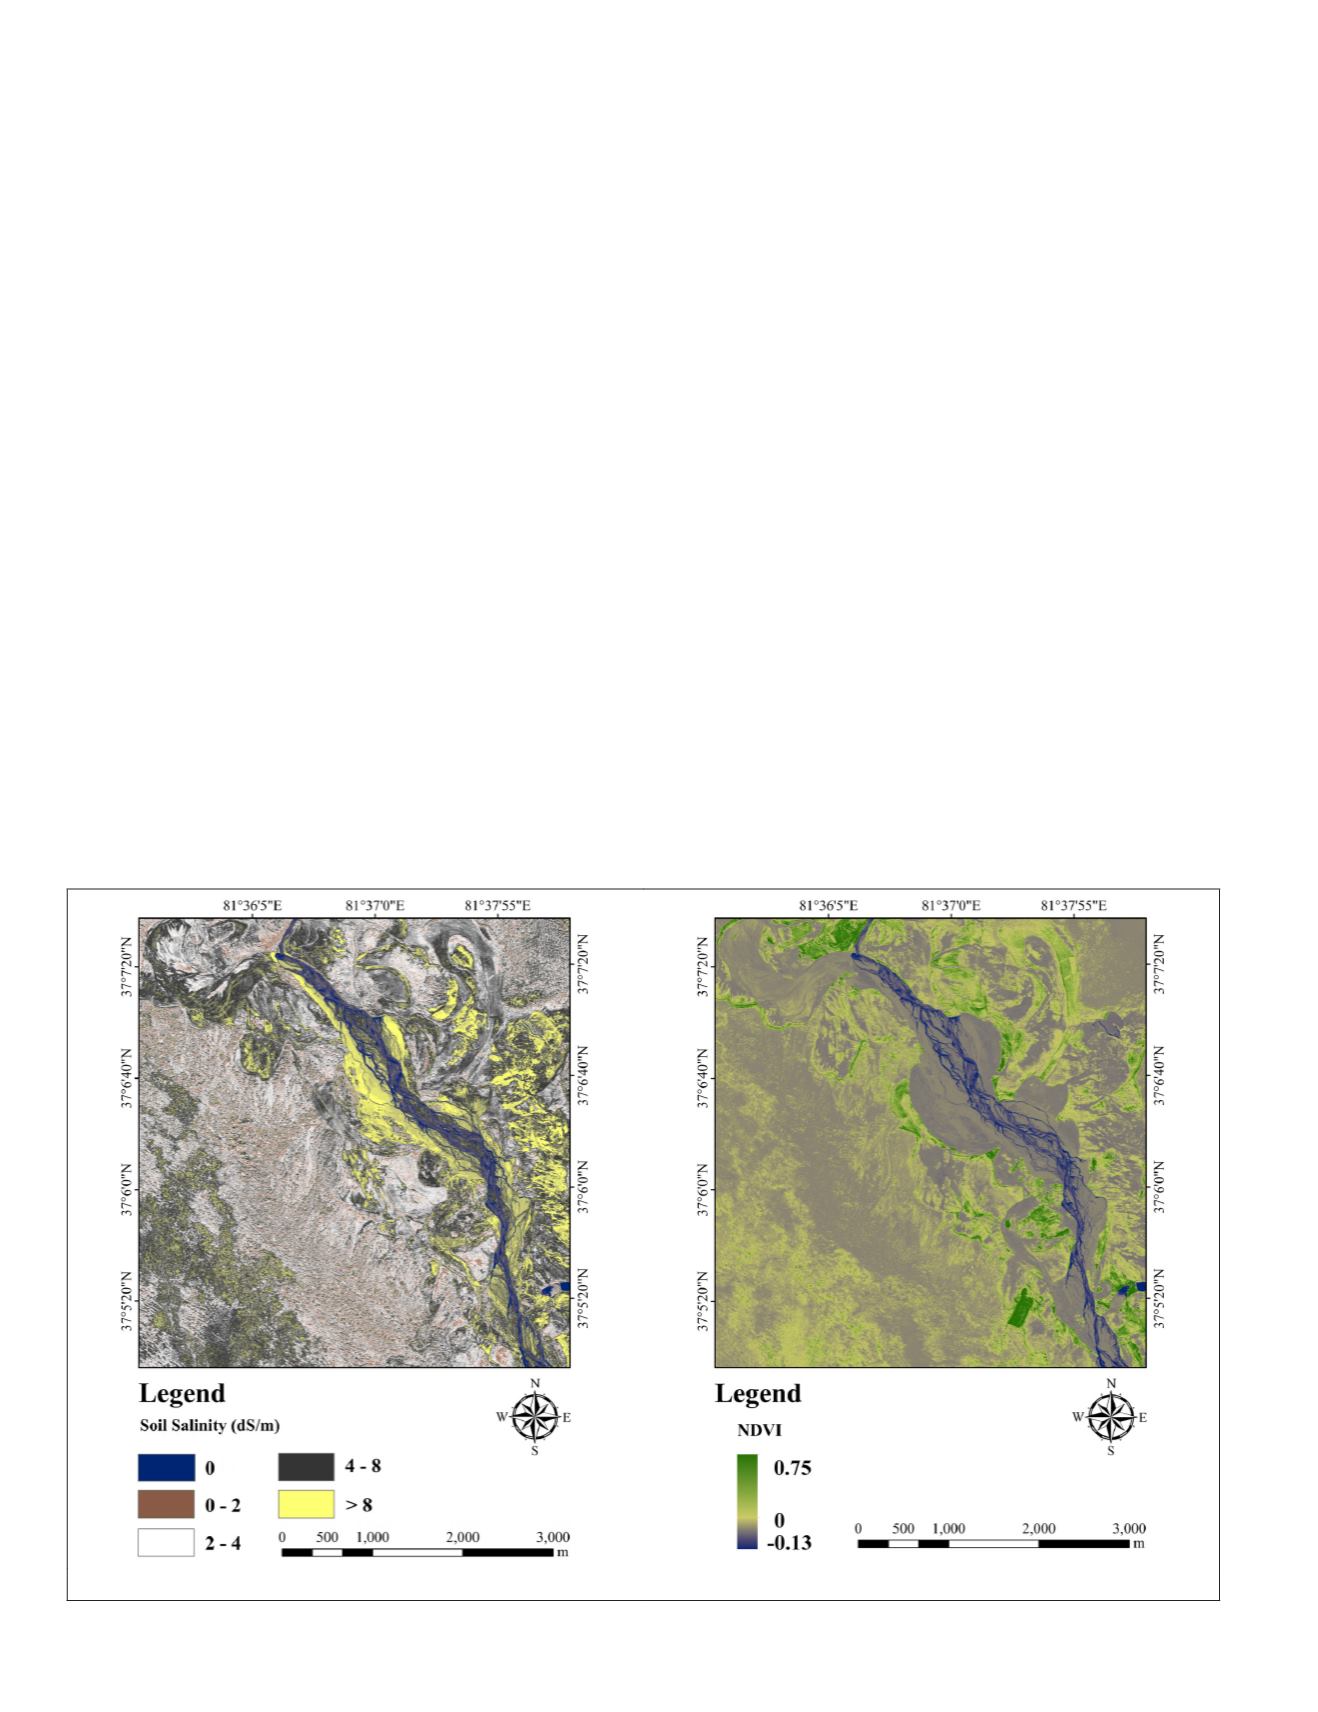
). To understand the spa-
tial distribution of soil salinity in the study area, the classifi-
cation results and the Normalized Difference Vegetation Index
(
NDVI
) distribution map was generated and is shown in Figure
6. As can be seen from the graph, the strongly saline soil (
EC
>
8 dS·m
-1
) primarily occurs on both sides of the Keriya River, in
areas that are characterized by low or no-vegetation coverage
and show high conductivity values. The higher the vegetation
coverage is, the lower the soil conductivity is. It also apparent
that the degree of vegetation coverage played an imperative
role in preventing and mitigating further soil salinization.
Discussion
Relationship between ECa and Spectral Index
In this study, we selected three sensitive bands and the
spectral index (
SAVI
) from WorldView-2 images. Based on the
variability of different soil-adjusted factors, the correlation
between soil-adjusted vegetation index (
SAVI
) and measured
electrical conductivity (
ECa
) was analyzed, and the index
corresponding to the optimal correlation was selected. With
the optimum index, the sensitive bands ((Red Edge) Band-6,
(Near-IR1) Band-7, and (Near-IR2) Band-8) and measured soil
conductivity (
ECa
), four
PLSR
models were generated (Model-
A, Model-B, Model-C, and Model-D), and the optimal model
was selected based on model accuracy. The efficiency of the
selected
PLSR
model (Model-D) to predict and map the spatial
variation in soil salinity showed the good predictability with
R
2
= 0.67 at the 99 percent probability level and
RMSE
of 1.19
dS·m
-1
. Many studies of soil salinization have been conducted
based on moderate and high spatial resolution images and
spectral indices. For instance, Shrestha (2006) and Afework
(2009) established empirical models (
R
2
= 0.23,
R
2
= 0.39) for
soil salinity estimation combined with indices (
SI
,
OLI-SI
,
NDVI
)
and images (Landsat
TM
and
ASTER
). Amal
et al
(2014) indicat-
ed the possibility of applying Ikonos images and indices (
SAVI
,
NDSI,
SI-T
) to predict soil salinization, and the regression
model yielded results with
R
2
= 0.65 and
RMSE
= 39 dS·m
-1
.
Based on this study and previous studies that assessed
soil salinity with sensitive bands, vegetation and soil salinity
indices, it is clear that with the variation of soil adjustment
parameter
L
, the correlation between the
SAVI
and
ECa
increas-
es. Hence, combining sensitive bands, the optimum index and
measured
ECa
to establish models has significance for retriev-
ing soil salinity.
Soil Salinity Modeling and Mapping Using the PLSR Method
In this study, the spatial distribution map of soil conductiv-
ity was made based on the optimum
PLSR
model using ENVI
software. Many studies of soil salinization have been carried
out using images of various resolution and various methods.
For instance, Ding and Yu
et al
. (2014) established models
based on Landsat images and EM38 data using universal
kriging (
UK
) and a spectral index regression (SIR) (
R
2
= 0.43,
R
2
= 0.39). Combined with indices (
SI
,
OLI-SI
,
NDVI
) and images
(Landsat
TM
and
ASTER
), Shrestha, (2006) and Afework, (2009)
established empirical models using a stepwise regression
method (
R
2
= 0.23,
R
2
= 0.39). Amal
et al
(2014) indicated the
possibility of applying Ikonos images and indices (
SAVI
, NDSI,
SI-T
) in the prediction of soil salinization using a stepwise
regression method, and the regression model yielded results
with
R
2
= 0.65 and
RMSE
= 39 dS·m
-1
. Thus, based on this and
previous studies, using high spatial resolution images and a
partial least-squares regression method increases the accuracy
of mapping and predicting soil salinity.
Figure 6. (a) Classification of Soil salinity (Left),and (b)
NDVI
distribution map (Right) for the part of Keriya River.
50
January 2018
PHOTOGRAMMETRIC ENGINEERING & REMOTE SENSING


