resolution (3030 m) of Landsat images has influenced the
model accuracy because salt concentrations in the soil profile
vary in a smaller range. In this research, to accurately assess
the soil salinity with improved spatial resolution, EM38-
MK2
-
measured
ECa
and high resolution WorldView data were used
to map soil salinity.
Many studies concerning remotely sensed soil salinity
monitoring have proposed different spectral indices that
provide a measure of soil salt content and remove the vegeta-
tion effect on the spectral characteristics of soils. Although
several studies assessed soil salinity using
EMI
measurements
and multispectral remote sensing data, resulting regression
models were simple and had low accuracy due to coarse
spatial resolution (Inkawu and Odeh, 2008). High resolution
remote sensing data,
EMI
measurements and various spectral
indices for salinity monitoring have been rarely used in the
study area. The overall goal of this paper was to develop ef-
fective combined spectral-based statistical
PLSR
models using
high-resolution images (WorldView-2) and ground-based
electromagnetic induction measurements to predict and map
the spatial variation of soil salinity near the Keriya River in
the Xinjiang Uyghur Autonomous Region of China.
Materials and Methods
Study Area
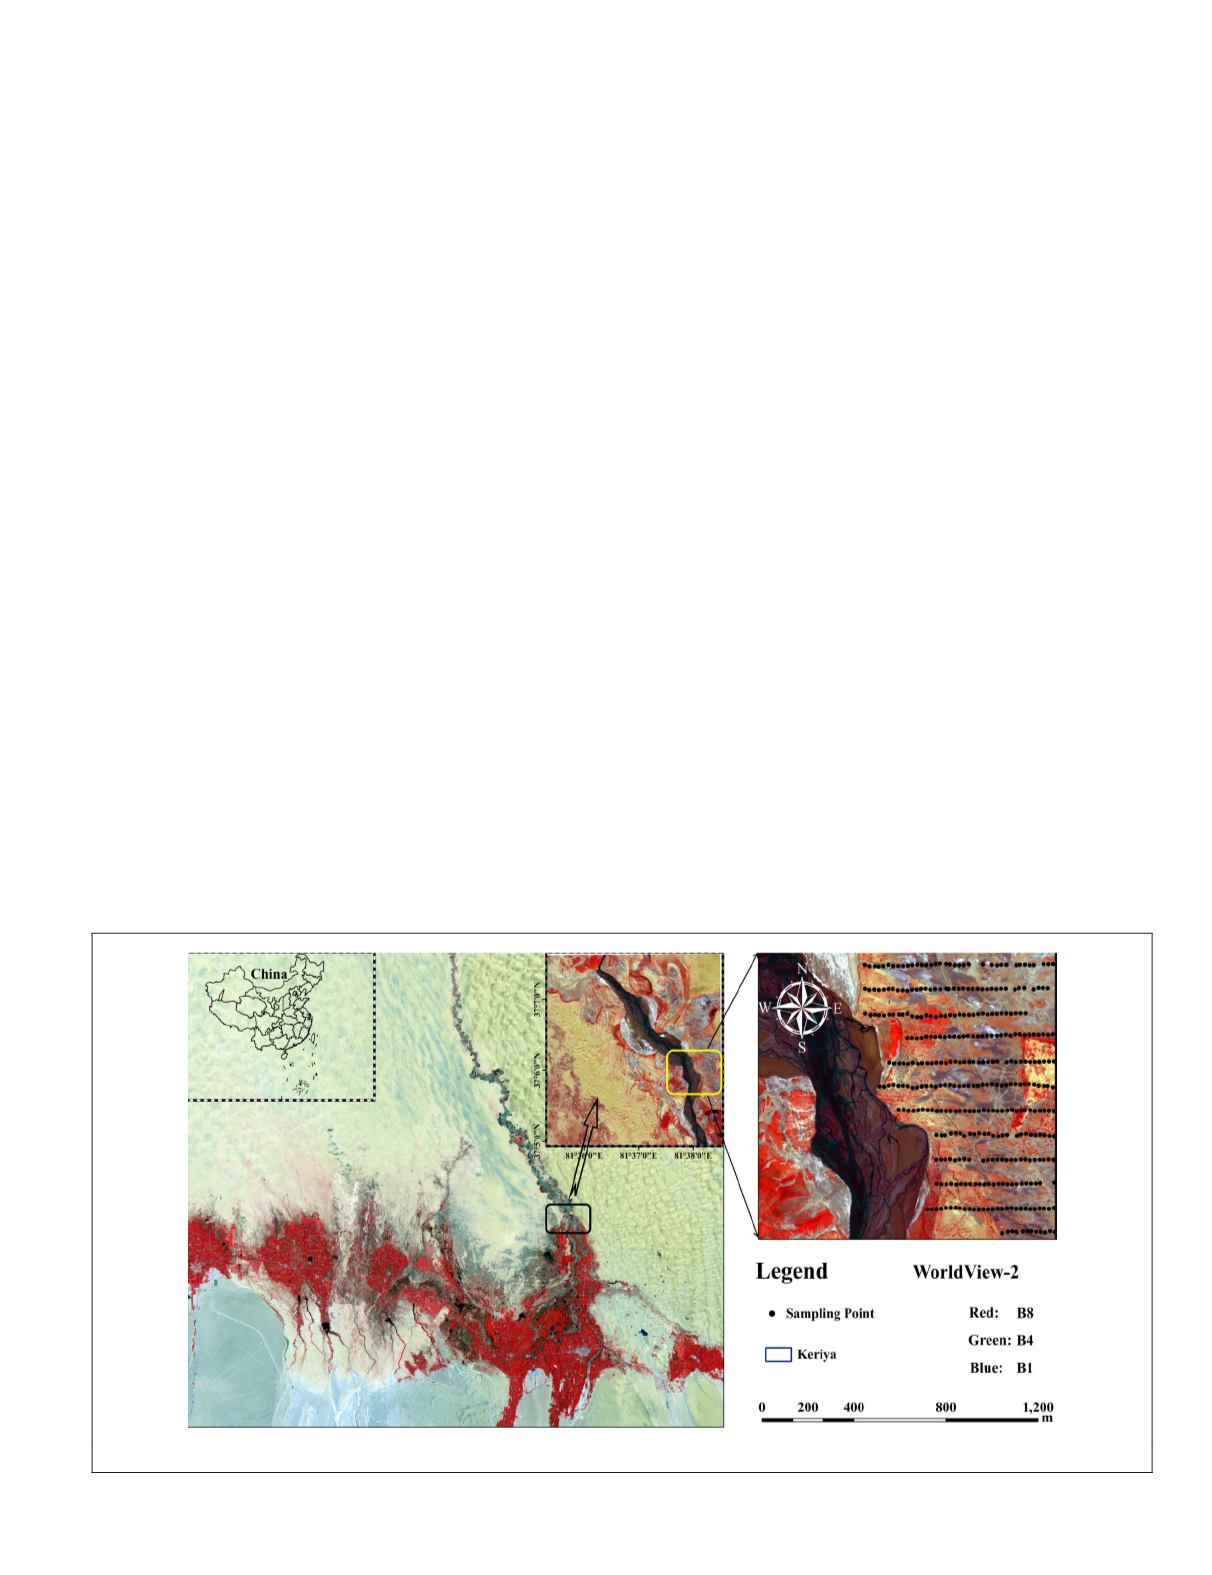
The Keriya River is located in the southern part of the Tarim
Basin in the Xinjiang Uyghur Autonomous Region of China
(Figure 1). This river originates from the Kunlun Mountains,
flows through the Keriya Oasis, and after approximately 700
km, the river ends in the hinterland of the Taklamakan Desert.
The river is primarily supplied by glacial melt, snow melt,
and precipitation in the Kunlun Mountains. This region has a
temperate continental arid climate that is characterized by hy-
per aridity. On average, the region receives 45 mm of precipi-
tation annually but experiences mean evaporation of 2,600
mm annually, which is more than 50 times the mean annual
precipitation (Ghulam
et al
., 2004). The oasis is located on a
fluvial plain with relatively flat terrain, loose soil, high salt
concentrations, and low soil fertility (Gong
et al
., 2015). Oasis
agriculture is the primary style of land-use, which relies on
the water resources from the Keriya River for irrigation. A
combination of the hyper-arid climate, topographic condi-
tions, and shallow groundwater level facilitated movement of
dissolved salts to the land surface. Such phenomena caused
soil salinization and desertification, especially in the transi-
tional belt between the oasis and the desert.
The riparian ecosystem of Keriya River is very fragile due
to the dry climate, low precipitation, high potential evapora-
tion, and active wind erosion. Most of the soils are sandy,
coarse in texture and low in nutrients (Sawut
et al
., 2014).
Sparsely vegetated riparian areas are covered with dominant
desert species such as
Phragmites australis
,
Tamarix chinen-
sis
,
Populus euphratica
,
Alhagi sparsifolia
,
Karelina caspica
and
Kalidium gracile
. The sample plot was selected in the
lower riparian area of the Keriya River because of the high
spatial variability in soil salinity, relatively flat terrain, and
sparse vegetation cover observed during the pilot investiga-
tion. Additionally, the riparian ecosystem became more vul-
nerable due to the intensified agricultural activities and deep
drainage systems in the upper reaches which brought more
leached saline water to the lower reaches. Therefore, inten-
sive understanding of the salt dynamics in the soil profile and
the timely monitoring of spatial distribution of soil salinity
have become an imperative task for both agricultural sustain-
ability and ecological stability.
Field Sampling
The sample plot was surveyed on 01-02 November 2014 using
an EM38-
MK2
meter (Geonics Ltd., Ontario, Canada) con-
nected with global positioning system (
GPS
) (GARMIN eTrex
Venture), and data logging unit. Transects were chosen based
on their geographic locations, local soil conditions, degree of
vegetation, and site accessibility. During the surveying, field
measurements were made strictly following the protocols and
guidelines for
EMI
field-scale measurements outlined by Cor-
win and Lesch (2013). The vertical dipole orientation mode
of the EM38-
MK2
meter, with one transmitter coil and two
receiver coils that are separated from the transmitter coil at
distances of 0.5 m and 1.0 m (Doolittle
et al
., 2014) (investiga-
tion depth of 0.75 m and 1.5 m), were used and measurements
Figure 1. Location of study area and distribution of sampling points.
PHOTOGRAMMETRIC ENGINEERING & REMOTE SENSING
January 2018
45


