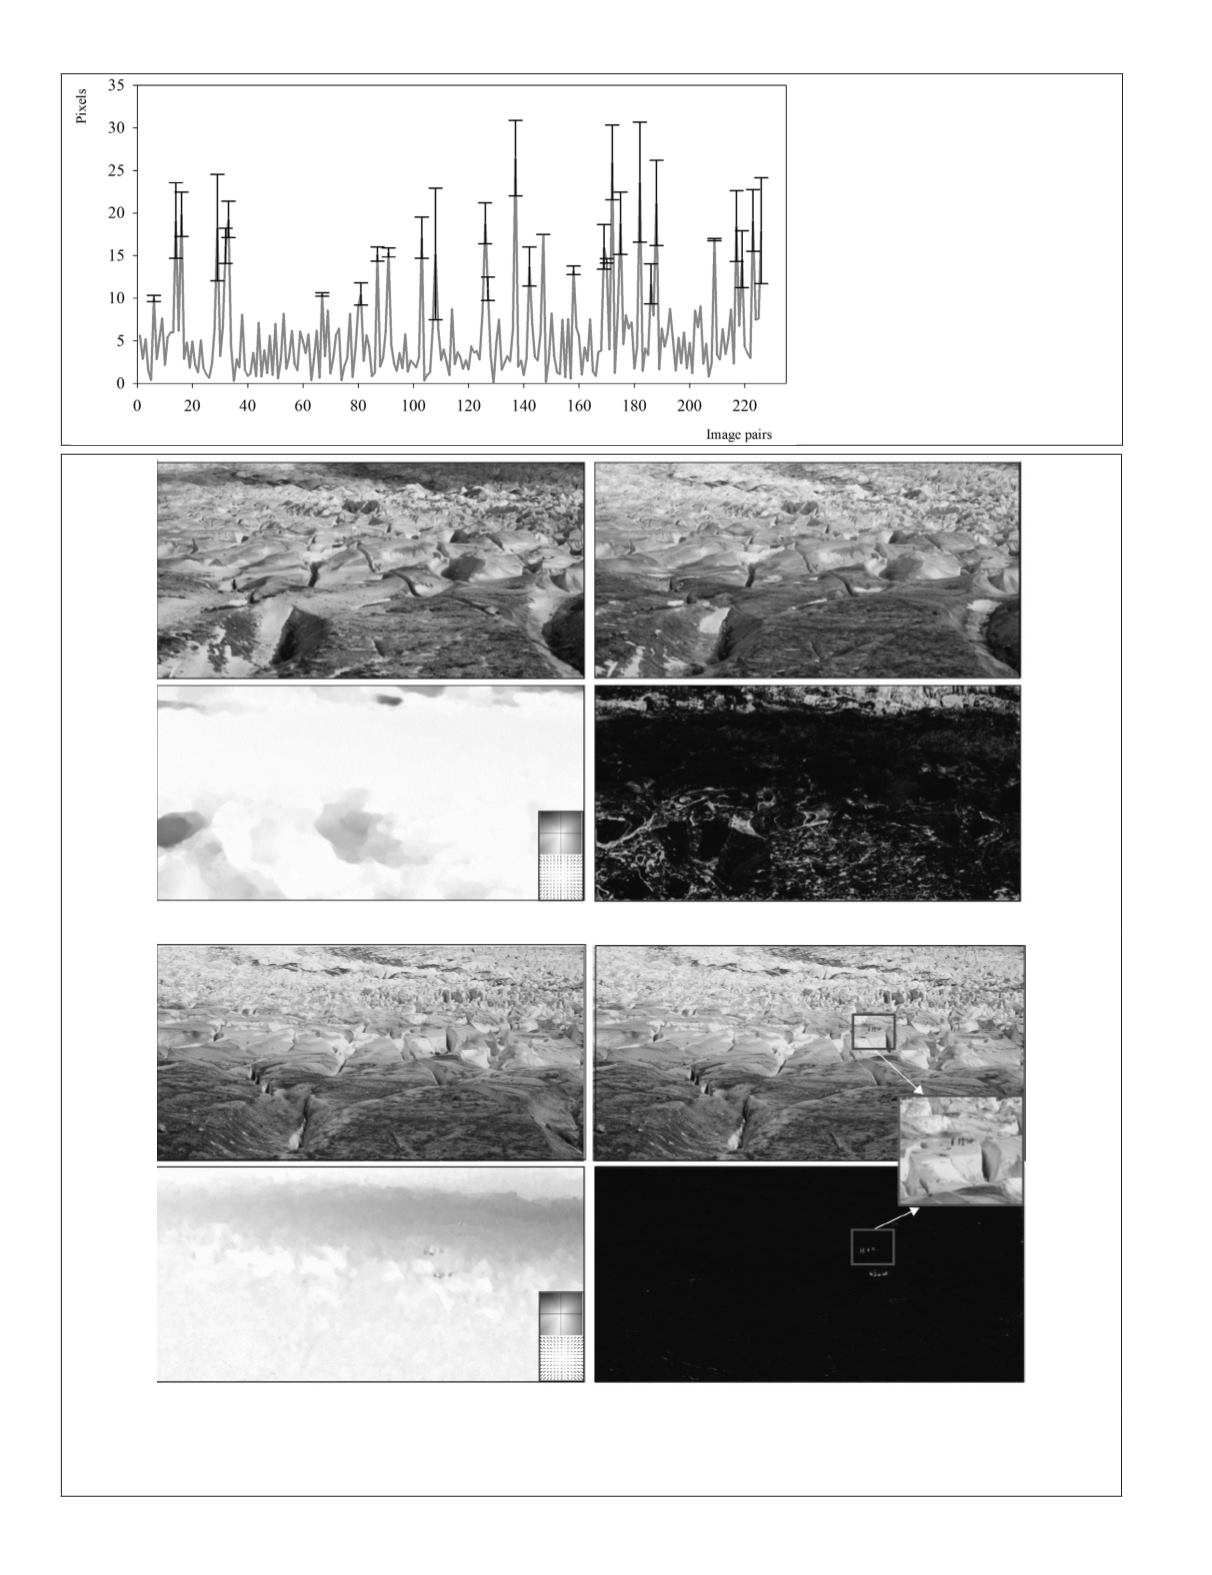
Figure 6. Mean error and standard
deviation (error bar) distribution for
the image pairs processed by
LDOF
.
(a)
(b)
Figure 7. The top frames in (a) and (b) show the image pairs selected to compute the LDOF, and below left the estimated flow
field with greyscale-coding for a better visualization; the error reconstruction are shown, respectively. Note that (a) represents
a significantly changing lighting condition resulting in poor estimation of the glacier motion, while (b) illustrates good
lighting conditions, and although the glacier has a large displacement, yet it is correctly matched.
40
January 2018
PHOTOGRAMMETRIC ENGINEERING & REMOTE SENSING


