were taken at 361 points along 12 transects (Figure 1). Raw
binary data files (N38) were converted to
ASCII
files (
M38
) in
the
DAT38MK2
(Geonics Ltd., Ontario, Canada) software
®
. An
average from five readings at each sample point was calcu-
lated at each point as the representative value of the apparent
electrical conductivity (
ECa
).
Model Generation and Data Analysis
To investigate soil salinity Using WorldView-2 Data and
EM38-
KM2
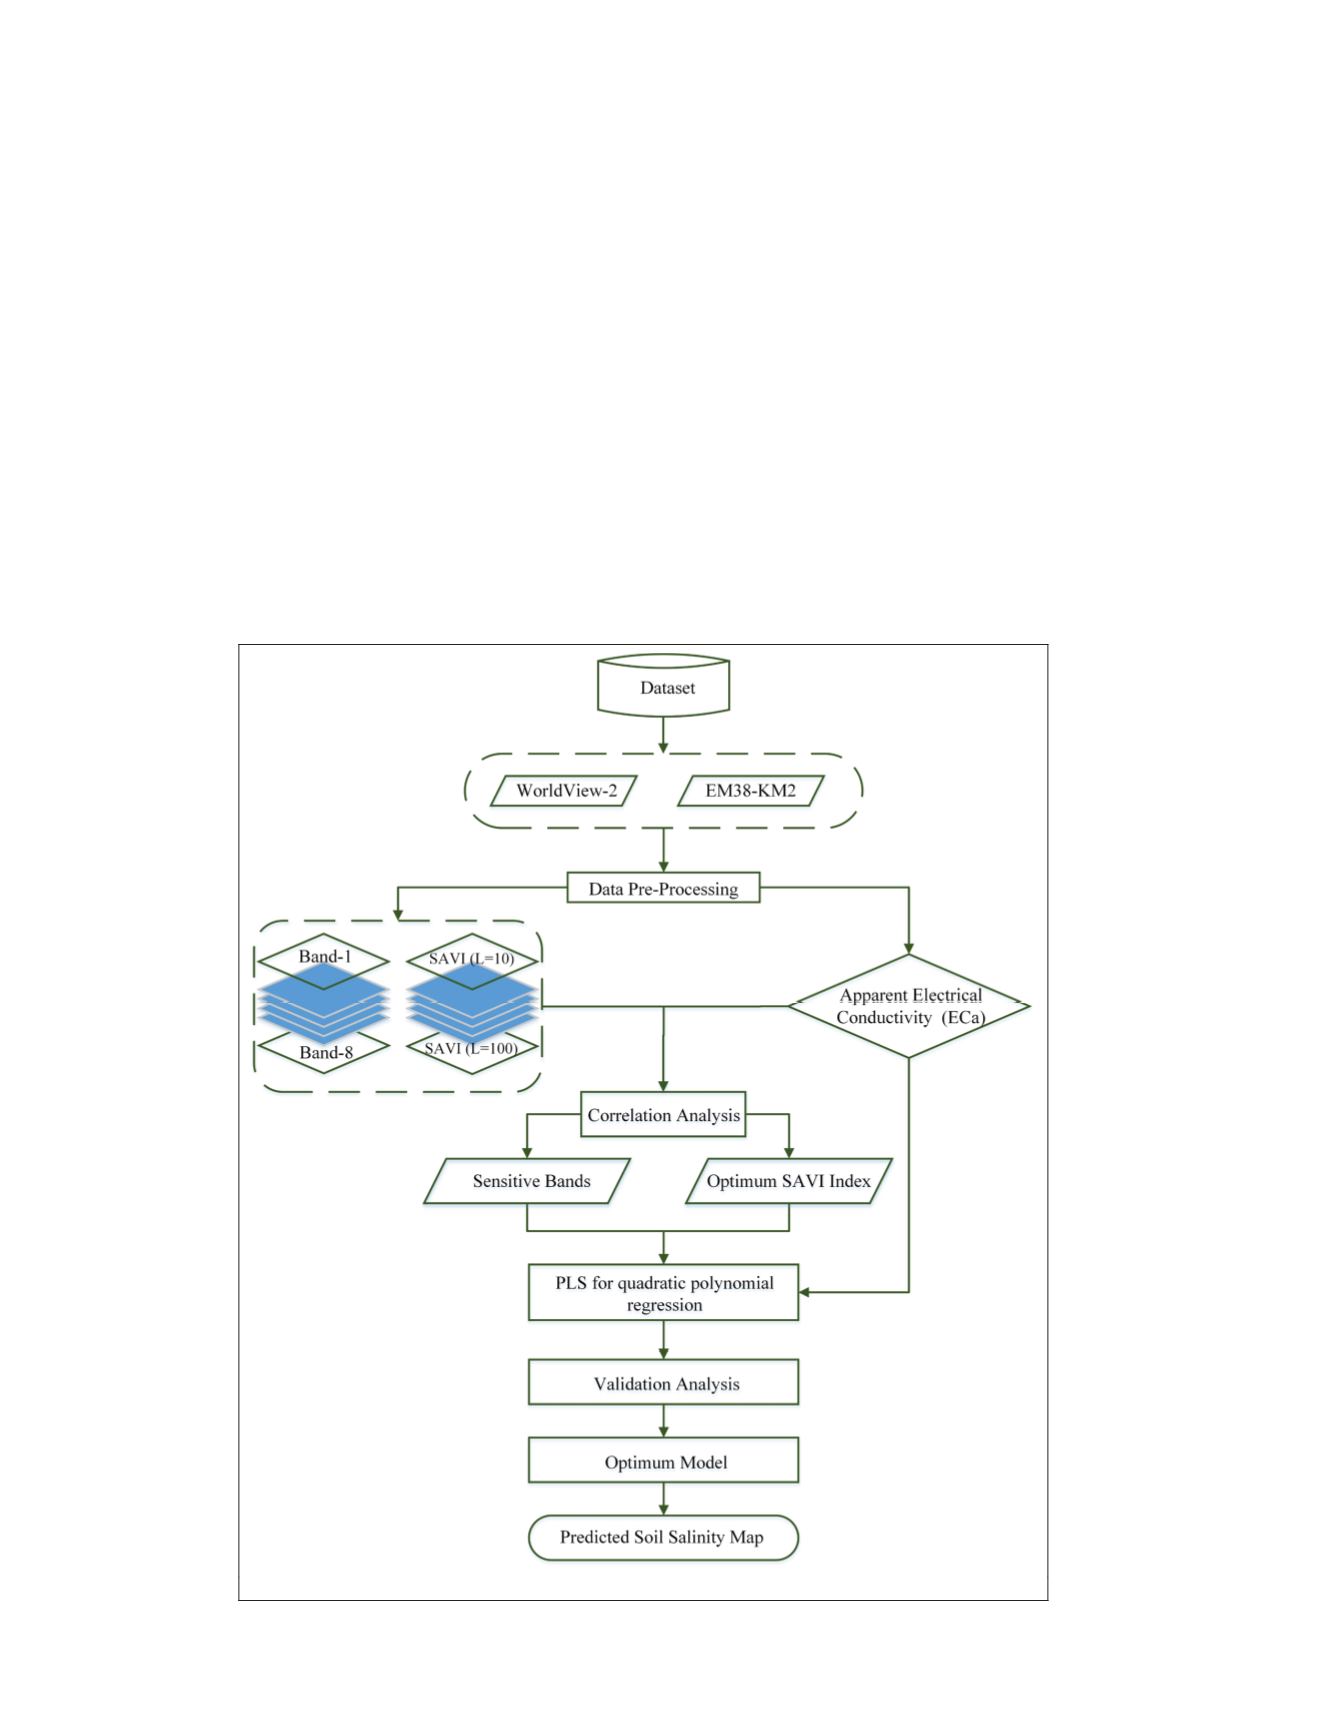
data in study area, we used the workflow presented in
Figure 2 and described in the following sections.
Partial Least-Squares Regression
PLSR
(Partial Least-Squares Regression) is a multivariate
regression method that specifies a linear relationship between
a set of dependent response variables,
Y
, and a set of predic-
tor variables,
X
(Haalan
et al
., 1988). It is a popular modeling
technique applied in Chemo-metrics, and commonly used for
quantitative spectral analysis. To select the optimum number
of factors and avoid overfitting, we calibrated the model by
an iterative leave-one-out cross-validation (
LOOCV
) criterion
called the minimum predicted residual sum of squares (
PRESS
)
RMSE
.
RMSE
is minimized by iteratively leaving one sample
out of the calibration dataset and calibrating the model from
the remaining dataset (Maimaitiyiming et al.2017;, Ghulam,
et al., 2004). (Geladi and Kowalaki 1986; Wold
et al
., 2001)
described the
PLSR
method in detail. The
PLSR
process was
performed using DPS
®
(Version16.05). The predictive ability
of the best selected
PLSR
model was assessed using the R
2
and
RMSE
on the independent validation dataset.
Satellite Data Acquisition and Processing
The image used in this study is WorldView-2 multispectral
data acquired on 06 October 2013 (purchased from the Insti-
tute of Remote Sensing and Digital Earth, Chinese Academy
of Science (
RADI
,
CAS
)). The remote sensing data includes
multispectral bands and is described in Table 2. The images
were geo-rectified to a Universal Transverse Mercator (
UTM
)
coordinate system using World Geodetic System (
WGS
) 1984
datum assigned to north
UTM
zone 44. Spectral radiometric
calibration and atmospheric and Geometric corrections were
performed on the WorldView-2.
FLAASH
model was used to
eliminate atmospheric and adjacency effects for images using
the Environmental for Visualizing Images (
ENVI
5.1,
EXELIS VIS
)
software package
®
. The WorldView-2 image was resampled
into 2-meter resolution and the River channel with water bod-
ies was clipped out due to the inaccessibility for sampling.
Figure 2. Overall workflow of the study.
46
January 2018
PHOTOGRAMMETRIC ENGINEERING & REMOTE SENSING


